India’s E85 Launch Has Begun. Without 2G Ethanol, the Supply Side Won’t Catch Up.

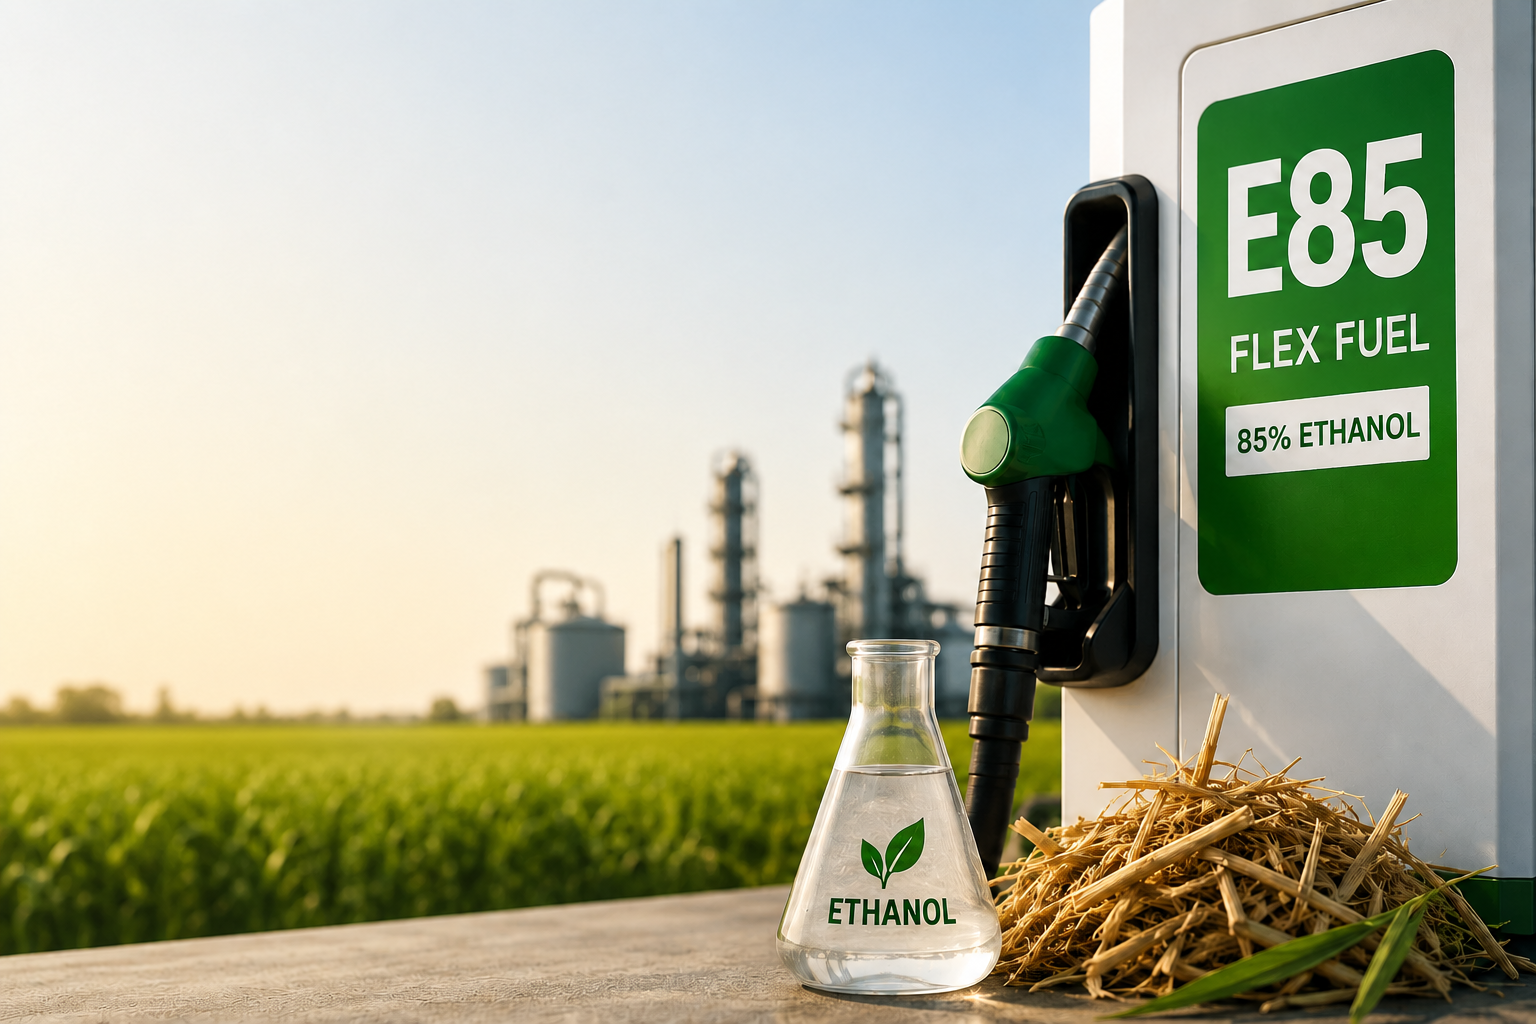
On June 5, 2026 – World Environment Day – Union Petroleum and Natural Gas Minister Hardeep Singh Puri formally launched E85 fuel at an Indian Oil retail outlet in New Delhi. The rollout began at 48 public sector fuel stations nationwide, priced at roughly ₹20 per litre below conventional petrol.

The expansion plan is aggressive:

  • 500 outlets by December 2026
  • 5,000 outlets by December 2027
  • Estimated lift to overall ethanol blending levels of ~26% by 2030–31 as E85 infrastructure scales

E85 contains 80–85% ethanol and 14–19% petrol, usable only in flex-fuel vehicles capable of running anywhere between E20 and E100. With the launch, India is no longer talking about flex-fuels as a future scenario. It is building a retail network for them, today.

And that changes the supply-side math for ethanol in a way the country has not yet fully reckoned with.

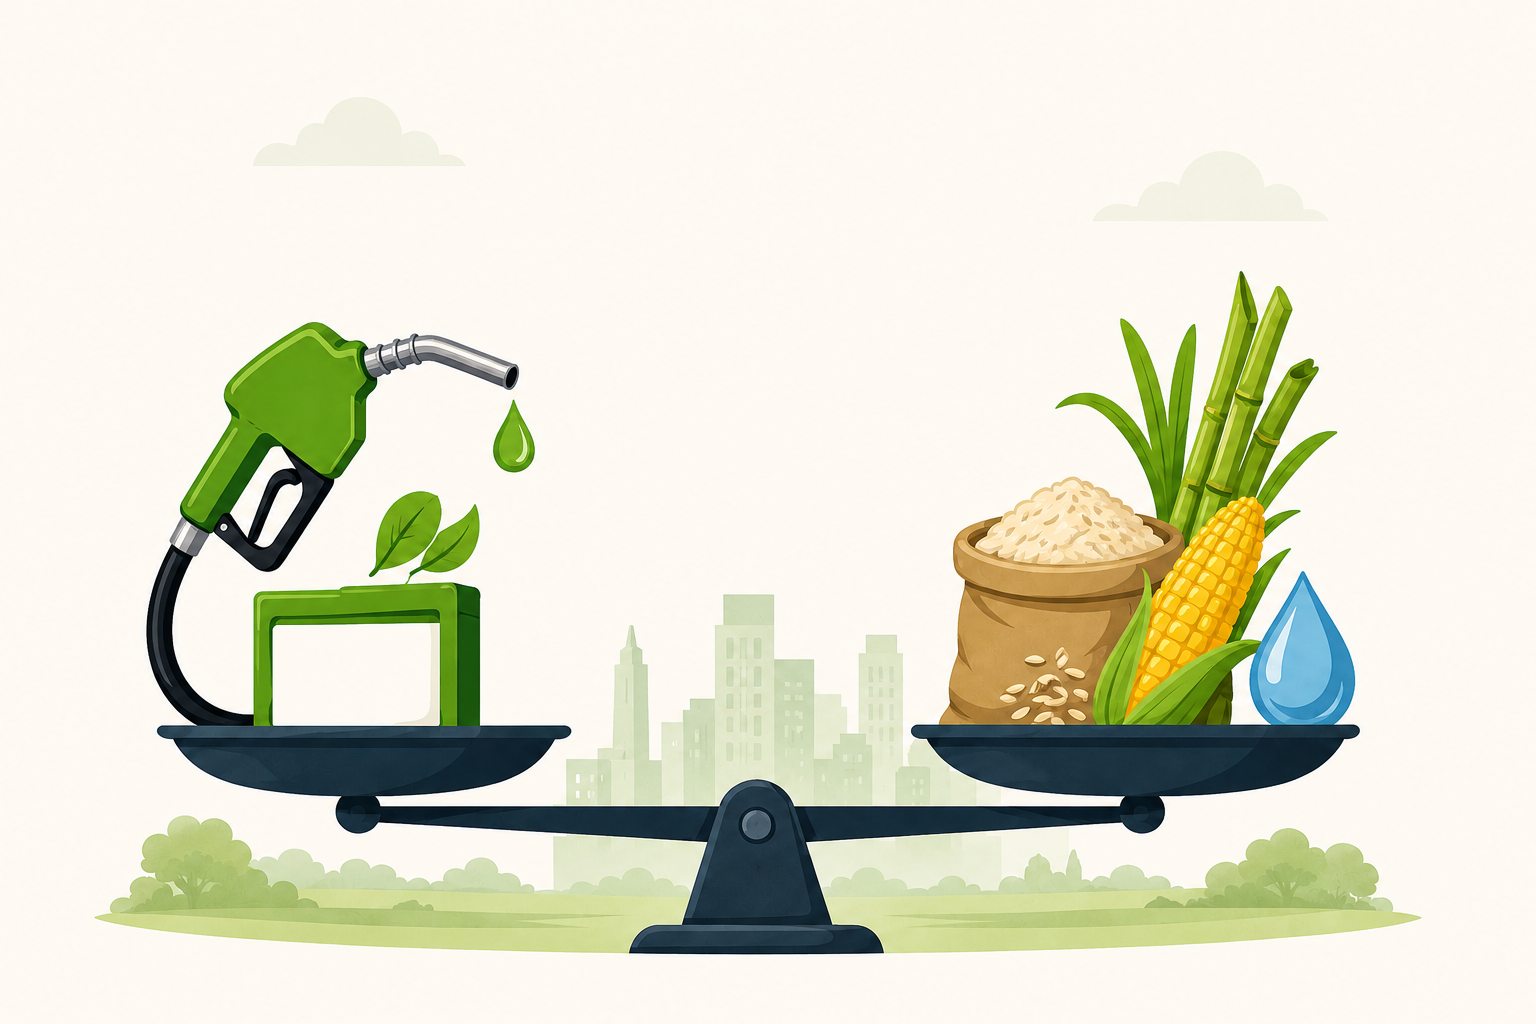
The simple version of the story: India already built the ethanol capacity needed to hit E20. The capacity needed to genuinely deliver E85 at scale is several times larger – and cannot be built sustainably on a first-generation (1G) ethanol foundation alone.

Second-generation (2G) ethanol – made from agricultural residues like rice straw – is no longer optional. It is the only feedstock pathway with the headroom to make E85 work.

What Was Launched, And Why It Matters

Three things about the June 5 launch are worth holding on to as the context for everything that follows.

1. The price signal is deliberate, and significant

E85 is being sold at approximately ₹20 per litre below conventional petrol. That gap is not accidental. It is the government’s way of front-loading consumer demand for flex-fuel vehicles before the FFV market exists at scale. The fuel is cheaper than petrol, denominated in rupees, and produced domestically. Energy security and consumer affordability arrive in the same package.

2. The infrastructure plan is national, not symbolic

Forty-eight stations on Day One. Five hundred by year-end. Five thousand by end-2027. This is not a pilot scheme dressed up for World Environment Day. It is the start of a structural retail rollout that, by late 2027, will put E85 within reach of a meaningful share of urban India’s vehicle population.

3. The Brazil benchmark is now openly on the table

The Petroleum Minister explicitly drew the parallel to Brazil, where more than 80% of light vehicles run on flex-fuel technology. India is signalling that flex-fuels are not a niche compliance product – they are intended to become the default architecture of the country’s petrol-vehicle market over the coming decade.

Ministry estimates released alongside the launch quantify what that ambition looks like in numbers:

  • If half of all new two-wheelers and passenger vehicles sold in India shift to flex-fuel technology, annual ethanol demand could rise by more than 312 crore litres (~3.12 billion L).
  • That transition would generate roughly ₹12,403 crore in additional farmer income.
  •  It would save about ₹15,151 crore in foreign exchange annually.
  •   It would cut transport-sector CO₂ emissions by approximately 66.4 lakh metric tonnes per year.
  • Lifecycle GHG emissions for an FFV running on E85 are estimated to be about 61% lower than a comparable conventional petrol vehicle.

These are not modest numbers. They are an explicit declaration that India is committing to flex-fuel scale. Which makes the next question the only one that matters: where will the ethanol come from?

The Demand Curve Just Got a Lot Steeper

Independent analysis is now putting hard numbers on the supply-side implications of E85.

A recent report by InCred Research projects that E85 adoption – layered on top of the existing E20 framework – will create a step-change in India’s ethanol demand profile by FY 2040:

YearEthanol demand: E20-only (base case)Ethanol demand: with E85 + FFV uptakeIncremental demand
FY 2026 (current)~13.0 billion litres~13.0 billion litres
FY 203015.80 billion litres16.04 billion litres+0.24 bn L
FY 2036 (FFVs at 50% of new petrol-vehicle sales)
Higher base growthSharp upward divergence beginsGrowing gap
FY 204025.74 billion litres29.63 billion litres+3.89 bn L  (~21% uplift)

The headline finding: by FY 2040, E85-driven flex-fuel adoption could add 3.89 billion litres of incremental annual ethanol demand – a 21% uplift above the E20-only base case. Total demand under that scenario would rise from approximately 13 billion litres in FY 2026 to 29.63 billion litres by FY 2040.

This is more than a doubling of current demand in 14 years.

And critically, the curve is back-loaded. In the early years (through FY 2030), demand grows only modestly because FFV penetration is still under 5%. But as flex-fuel vehicles scale from ~1% of new petrol vehicles in FY 2027 to 50% by FY 2036, the incremental demand begins compounding sharply. The biggest supply-side pressure is in the second half of the decade. Which means the capacity to meet it has to be built now, not then.

It also means that a 21% demand uplift is the conservative estimate. If flex-fuel penetration moves faster – as it well might if consumer economics keep working in E85’s favour – the supply gap grows even larger. India’s E20 rollout itself was, just a few years ago, considered unrealistic. The same momentum that surprised the country into hitting E20 ahead of schedule can do exactly that with E85.

Why 1G Ethanol Cannot Carry This Load

India’s installed ethanol production capacity has scaled impressively – from 420 crore litres in 2013–14 to roughly 2,000 crore litres (20 billion litres) by late 2025. On paper, that looks comfortable: capacity already exceeds the ~1,050 crore litres needed to sustain E20.

But the headline capacity number obscures three structural truths that make scaling 1G ethanol toward E85 effectively impossible.

FeedstockCeiling for E85 scalingWhy
Sugarcane (1G)ConstrainedHighly water-intensive (~3,630 L water per L ethanol); concentrated in already water-stressed Maharashtra, UP, Karnataka; competes with sugar exports and consumption
Maize (1G)Limited60% of maize currently used as poultry feed; further diversion raises feed prices; rain-fed varieties still in scale-up
Broken / surplus rice (1G)
Already politically saturated
PDS broken-rice share already cut from 25% to 10% to free up 90 lakh tonnes for ethanol – further diversion creates food-security exposure
Rice straw + agri residues (2G)Largely untappedIndia generates ~160–180 million tonnes of paddy straw alone every year, much of it burned in fields. No competition with food, water, or land use

The food-fuel pressure is already at the limit

In March 2026, the Centre cut the share of broken rice in Public Distribution System allocations from 25% to 10% – redirecting roughly 90 lakh tonnes (9 million MT) of rice annually from the PDS to ethanol distilleries. That moved a substantial volume of food-grade grain into the fuel system. Scaling 1G ethanol further to meet E85 demand would mean either deeper rice diversion, larger sugarcane planting on already water-stressed land, or more maize diversion away from poultry feed. Each pathway exports the problem somewhere else.

The water footprint is incompatible with India’s hydrology

Government data shared by the Food Secretary itself indicates that producing one litre of ethanol uses approximately 10,790 litres of water from rice, ~4,670 litres from maize, and ~3,630 litres from sugarcane (cultivation plus processing). NITI Aayog’s Composite Water Management Index has warned that 21 major Indian cities face critical groundwater depletion by 2030. Multiplying 1G ethanol output by 2x or 3x to meet E85 demand means multiplying that water draw at the same pace – much of it in states where the groundwater is already stressed.

The 1G capacity story is plateauing

Even with another 400 crore litres of 1G capacity expected to come online by FY27, the gap to 30 billion litres of demand by FY 2040 remains very wide. And every incremental tonne of sugarcane or maize required becomes harder to source as competing demands – sugar exports, ethanol pricing, livestock feed, food inflation – bid against each other.

The conclusion is unavoidable: if India tries to deliver E85 at scale on 1G feedstock alone, it will run into food, water, and feedstock walls long before it reaches the InCred-projected demand curve.

Why 2G Ethanol Is the Only Pathway With Real Headroom

Second-generation ethanol changes the supply-side equation because it changes the feedstock category entirely.

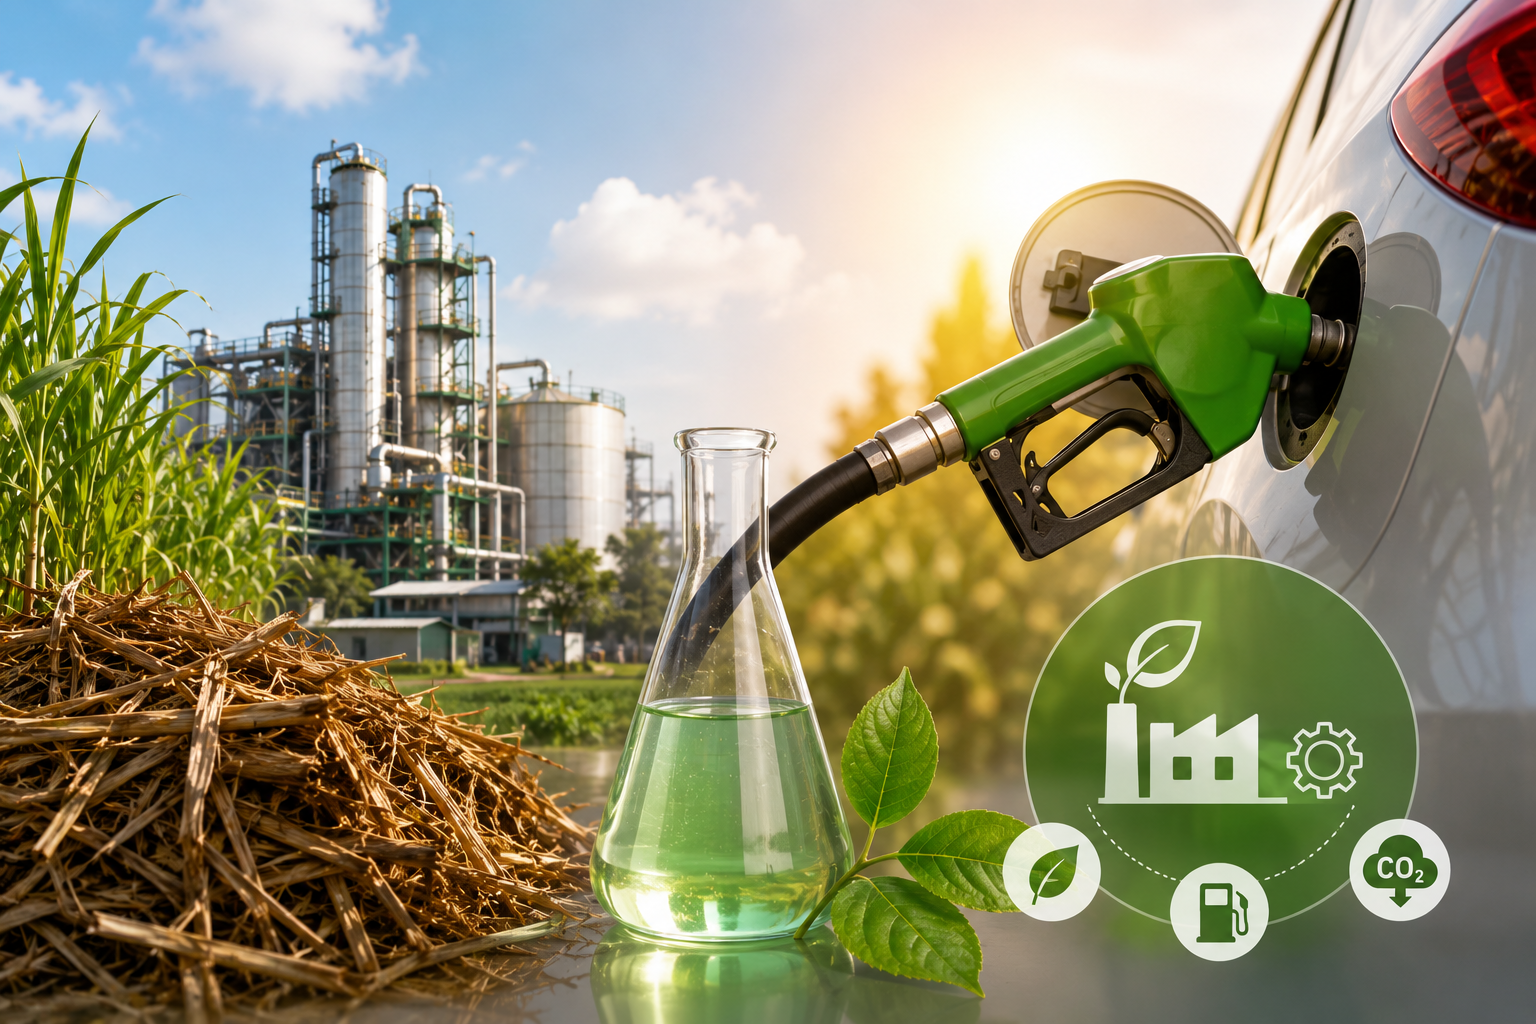
2G ethanol is produced from lignocellulosic biomass – primarily agricultural residues like rice straw, wheat straw, and sugarcane bagasse. These are materials that:

  •  Are already being generated as a byproduct of food agriculture (the food has already been harvested before the residue exists)
  • Are largely burned, dumped, or left to decay today – particularly rice straw in Punjab and Haryana, which is the single largest contributor to North India’s winter air pollution
  • Do not require additional water, land, or fertiliser inputs – the crop was grown for food, not for fuel
  • Are produced at vast scale: India generates roughly 160–180 million tonnes of paddy straw alone every year, alongside large volumes of wheat straw, bagasse, corn stover, and cotton stalks

On a sheer feedstock-availability basis, 2G ethanol has the headroom to absorb most of the incremental demand E85 will create – without competing with food, water, or land use.

It also delivers a structurally cleaner carbon profile. The 61% lifecycle GHG reduction figure cited by the Petroleum Ministry for E85 understates what is possible when the ethanol is 2G: residues that would have been burned (releasing CO₂ anyway) or decayed (releasing methane) are instead converted into transport fuel. The avoided emissions and the substitution emissions stack.

And critically, 2G ethanol is feedstock-resilient. Agricultural residues are generated whether sugar prices spike, monsoons disappoint, or maize markets tighten. For a country trying to commit to a multi-decade flex-fuel transition, that resilience matters as much as the volume.

The Policy and Investment Gap

If 2G ethanol is the supply-side answer, the obvious question is: why hasn’t it scaled already?

Three reasons, all addressable:

  • Capital intensity. A 2G ethanol plant typically costs significantly more per kilolitre of installed capacity than a 1G plant. Without policy support that explicitly reflects the externalities 2G saves (water, food, air quality), the investment math has historically lagged.
  •  Biomass logistics. Rice straw and other residues are bulky, seasonal, and dispersed. Aggregating them at refinery scale requires biomass collection networks, storage infrastructure, and farmer-aggregator partnerships that take years to mature.
  • Technology maturity. Earlier 2G installations in India have struggled to operate at design capacity, creating investor caution. What is needed is proven, commercially validated technology platforms – including the ability to extract additional value from lignin and silica co-products to improve unit economics.

The good news is that all three constraints are now being directly addressed:

  • PM JI-VAN Yojana continues to fund commercial 2G biorefinery development on lignocellulosic feedstocks.
  • The National Policy on Biofuels (2018, amended 2022) explicitly recognises 2G ethanol as an “advanced biofuel” with higher pricing support.
  •  Long-Term Offtake Agreements (LTOAs) with oil marketing companies are providing the demand-side certainty needed to underwrite 2G investments.

What is now needed is execution velocity – building 2G capacity at the same pace the E85 retail network is being built. Anything less, and the country will arrive at 5,000 E85 stations in December 2027 without the ethanol to sustainably fill them.

Where Khaitan Bio Energy Fits In

The case for 2G ethanol becomes meaningful only when the technology to produce it works economically and reliably at commercial scale. That has been the persistent gap in India’s biofuel ecosystem – and it is the gap [Khaitan Bio Energy](https://khaitanbioenergy.com/) was built to close.

The company’s patented 2G ethanol technology – developed over many years by Mr Rohit Khaitan and validated through a BIRAC-supported pilot under the “Cellulosic Ethanol Pilot Plant for Rice Straw Management” project – establishes a commercially viable cellulose-to-sugars-to-ethanol pathway.

Three credentials are directly relevant to the E85 supply challenge:

  • The technology is certified at Technology Readiness Level 8 (TRL-8) by the Department of Biotechnology, Government of India – meaning commercial deployment readiness, not laboratory stage.
  •  It has been successfully evaluated by the Centre for High Technology, Ministry of Petroleum and Natural Gas.
  • It is one of the rare 2G platforms that fully valorises every component of lignocellulosic biomass – producing not only 2G ethanol, but also high-purity precipitated silica and gypsum as co-products. This breakthrough in lignin valorisation transforms 2G unit economics from marginal to competitive, addressing the historic capital-intensity problem at the unit-economics level.

For an India where 5,000 retail outlets will soon be dispensing E85, and where InCred projects ethanol demand more than doubling by 2040, this kind of platform is precisely the supply-side bridge the transition needs.

The Road Ahead

The June 5, 2026 launch of E85 is one of the most consequential moments in India’s energy transition. Forty-eight retail outlets today. Five thousand by 2027. Twenty-one per cent additional ethanol demand by 2040. A ₹20-per-litre price advantage that will pull consumer adoption forward. The Brazil benchmark, openly on the table.

On the demand side, the architecture is being built – at speed, with political will, and with consumer economics aligned.

On the supply side, the country has a choice. India can try to meet that demand by leaning harder on sugarcane, maize, and rice – trading its oil-import problem for food and water problems it is far less equipped to solve. Or it can scale 2G ethanol at the pace E85 is being rolled out – turning the rice straw that is currently burning in fields into the fuel that powers the next decade of Indian mobility.

Both pathways arrive at the same numerical destination. Only one of them is sustainable.

E85 is the demand signal India has been waiting for. 2G ethanol is the supply answer the country can no longer afford to delay.

Frequently Asked Questions

Q1. What is E85 fuel and where is it available in India?

E85 is petrol blended with 80–85% ethanol and 14–19% petrol, usable only in flex-fuel vehicles (FFVs) capable of operating on blends from E20 to E100. India launched E85 on June 5, 2026 at 48 public sector fuel stations nationwide, priced approximately ₹20 per litre below conventional petrol. The government plans to expand availability to 500 outlets by December 2026 and 5,000 outlets by December 2027.

Q2. How will the E85 launch affect India’s total ethanol demand?

Significantly. According to a recent InCred Research projection, E85 adoption layered on top of the E20 framework would increase total ethanol demand from approximately 13 billion litres in FY 2026 to 29.63 billion litres by FY 2040 – a 21% uplift above the E20-only base case, or 3.89 billion litres of incremental annual demand. The biggest demand growth is expected after FY 2036 as flex-fuel vehicle penetration scales toward 50% of new petrol vehicle sales.

Q3. Can India produce enough ethanol for E85 using only 1G ethanol (sugarcane, maize, rice)?

Not sustainably. India’s current ethanol production capacity (~2,000 crore litres) is sufficient for E20, but scaling toward 30 billion litres by 2040 on 1G feedstocks alone runs into structural ceilings – sugarcane’s water footprint, the food-vs-fuel pressure on rice (already diverting 90 lakh tonnes annually from the PDS), and maize’s existing role in poultry feed. 2G ethanol from agricultural residues is the only pathway with the feedstock headroom to meet incremental E85 demand without enlarging food, water, or land-use conflicts.

Q4. What is 2G ethanol and how is it different from 1G?

Second-generation (2G) ethanol is produced from lignocellulosic biomass – agricultural residues like rice straw, wheat straw, and sugarcane bagasse. Unlike 1G ethanol (made from food crops such as sugarcane juice, maize, or rice), 2G ethanol uses materials that are already a byproduct of food agriculture. The grain still goes to the kitchen; the stubble that would otherwise be burned goes to the fuel tank. No incremental water is consumed, and no food is diverted.

Q5. Why is E85 priced ₹20 per litre cheaper than petrol?

Two reasons. First, ethanol is produced domestically, so it avoids the import cost of crude oil. Second, the price differential is a deliberate policy signal designed to accelerate consumer adoption of flex-fuel vehicles before the FFV market exists at scale. The Petroleum Ministry has indicated that domestic fuel prices have seen among the lowest increases globally since February 2026, with ethanol blending playing a meaningful role in that stability.

Q6. How much will E85 reduce greenhouse gas emissions?

Ministry estimates indicate flex-fuel vehicles running on E85 can reduce lifecycle greenhouse gas emissions by approximately 61% compared with conventional petrol vehicles. When the underlying ethanol is 2G (produced from rice straw or other agricultural residues), the lifecycle savings are deeper still – because residues that would otherwise have been burned or decayed are converted into fuel, stacking avoided emissions with substitution emissions.

Q7. What is Khaitan Bio Energy’s role in India’s E85 transition?

Khaitan Bio Energy holds patents for a 2G ethanol production technology certified at TRL-8 by the Department of Biotechnology and selected for commercial biorefinery development under the PM JI-VAN Yojana. The technology converts rice straw and other lignocellulosic biomass into ethanol, alongside high-value co-products like high-purity precipitated silica and gypsum – addressing the historic unit-economics challenge of 2G ethanol. For an India scaling toward 5,000 E85 retail outlets and 30 billion litres of ethanol demand by 2040, this kind of platform is exactly the supply-side bridge the transition will rely on.

E30 Is Coming. Can India Afford to Get There on Food and Water?

On May 15, 2026, the Bureau of Indian Standards quietly published a notification that will shape India’s clean fuel future for the next decade. IS 19850:2026 formally established technical specifications for E22, E25, E27, and E30 fuel blends – petrol blended with up to 30% ethanol – for use in positive-ignition engine vehicles.

Industry bodies welcomed it. The All India Distillers’ Association called it a “critical step.” Ethanol producers, sitting on surplus capacity, saw a long-awaited demand signal. The political logic was clean: less imported crude, more rural income, lower transport emissions.

But behind the policy momentum, two quieter questions are gathering force in independent research, government data, and even within NITI Aayog’s own warnings:

  • Where will the feedstock for E30 come from?
  • How much food and how much water will India have to give up to get there?

The answers matter. Because if India tries to reach E30 the way it reached E20 – by leaning harder on sugarcane, maize, and rice – the country could end up trading one form of import dependence (oil) for two others India can far less afford to lose: food security and groundwater.

This is the structural case for why E30 cannot be built on first-generation ethanol alone. And why second-generation (2G) ethanol – made from agricultural residues like rice straw – is no longer an alternative pathway. It is the only sustainable one.

Where India Stands: From E20 Achieved to E30 Notified

India’s ethanol blending journey has moved at a remarkable pace:

  • ~1.5% blending in 2014 → 14.6% in 2023–24 → 20% by April 2026
  • The E20 target was hit nearly five years ahead of the original 2030 deadline.
  • Installed ethanol production capacity has grown from 420 crore litres in 2013–14 to roughly 2,000 crore litres by late 2025, with another 400 crore litres expected by FY27.
  • Over ₹1.25 lakh crore has flowed to farmers through ethanol procurement, and over ₹1.44 lakh crore has been saved in foreign exchange through reduced crude imports.

Against this track record, the BIS notification for E22–E30 isn’t a leap. It’s the logical next step. The Petroleum Ministry has already commissioned ARAI to study E25’s impact on existing vehicles. A government committee is preparing the roadmap beyond E20 – with E27 and E30 squarely in view.But the question that the notification does not answer is the one that matters most: what will fuel the fuel?

The Food Question: 1G Ethanol Is Now Eating Into the Public Distribution System

To understand how serious the food-vs-fuel trade-off has become, look at what changed in March 2026.

The Centre announced that the share of broken rice in grains distributed under the Public Distribution System (PDS) would be cut from 25% to 10%. The 15-percentage-point gap – roughly 90 lakh tonnes (9 million metric tonnes) of broken rice annually – would be redirected to ethanol distilleries.

Put plainly: rice that was being eaten by 80 crore PDS beneficiaries will now be converted into automotive fuel.

This is not an isolated policy choice. It is part of a clear trajectory:

YearFCI broken rice diverted to ethanolPolicy lever
Ethanol Supply Year 2024–25~52 lakh tonnes (5.2 million MT)FCI surplus rice auctions to distilleries
Ethanol Supply Year 2025–26 (target)~90 lakh tonnes (9 million MT)Broken rice in PDS reduced from 25% to 10% – surplus 15% redirected to ethanol
E25 demand scenario (2027–28)Substantially higher if 1G-dependent
Likely additional rice / maize / sugarcane diversion
E30 demand scenario (BIS-notified, post-rollout)Structurally unworkable on 1G aloneRequires 2G ethanol at scale

Defenders of the policy argue, with some justification, that India is sitting on surplus rice. FCI’s rice buffer norm is around 13.5 million tonnes; actual stocks have ballooned past 50 million tonnes – roughly four times the buffer requirement. From this angle, ethanol is absorbing waste, not taking food off the table.

But that argument has cracks that widen as blending scales:

  • Surplus is a feature of bad logistics, not abundance. As the Comptroller and Auditor General has noted repeatedly, FCI surpluses reflect procurement and redistribution inefficiencies – not surplus food in the system. The same grain could fortify school meals, anganwadi programmes, urban nutrition schemes, or function as a strategic buffer against climate-driven supply shocks.
  • “Broken” rice is not unfit for human consumption. It is whole rice with broken kernels – still nutritionally identical. Categorising it as industrial feedstock is a policy choice, not a biological reality.
  • The mechanism is structural, not transitional. Cutting PDS broken rice allocation from 25% to 10% means the diversion is now baked into the supply chain. Reversing it would require re-engineering procurement norms across five major rice-producing states.
  • Demand will keep climbing. E20 absorbs roughly 1,050 crore litres of ethanol per year. E25 will push that toward 1,300–1,400 crore litres. E30, if rolled out, will need substantially more – and at higher blends like E85 or E100 (under flex-fuel scenarios), industry estimates point to 15–25 billion litres of additional dependable capacity being required.

Each step up the blending curve, if delivered through 1G ethanol, increases the volume of food crops being diverted from kitchens to fuel tanks. At E30, that volume becomes structurally large enough that it cannot be defended as “surplus absorption” anymore. It is a deliberate reallocation of the food system into the fuel system.

The Water Question: Trading Oil Dependence for Water Depletion

If the food story is uncomfortable, the water story is alarming.

Earlier in 2026, NITI Aayog’s Composite Water Management Index reiterated a warning that should be impossible to ignore: groundwater in 21 major Indian cities – including Delhi, Bengaluru, Chennai, and Hyderabad – is on track toward critical depletion by 2030.

India’s per capita water availability has already fallen to roughly 1,486 cubic metres (2021) – placing it firmly in the “water-stressed” category. Projections suggest it will drop to around 1,140 cubic metres by 2050. Agriculture, meanwhile, consumes nearly 80% of the country’s freshwater.

Against that backdrop, here is what each litre of 1G ethanol actually costs India in water:

Feedstock pathwayGenerationWater per litre of ethanolSource of water
Rice (paddy)1G~10,790 litresHeavy irrigation; groundwater-fed in Punjab, Haryana, UP
Maize1G~4,670 litresMix of rain-fed and irrigated; lower than rice
Sugarcane (molasses)1G~3,630 litres (some estimates ~2,860 L per NITI Aayog 2021)High irrigation; concentrated in water-stressed Maharashtra, Karnataka, UP
Rice straw / agricultural residue (2G)2GNegligible (process water only – feedstock is already waste)No new agricultural water demand

These numbers – the rice figure cited by the Food Secretary himself, the sugarcane figure from NITI Aayog’s 2021 ethanol roadmap, and the maize figure from government data – describe a fuel pathway whose hidden price is paid not at the pump but at the borewell.

A litre of ethanol made from rice can consume nearly 11,000 litres of water across cultivation and processing. India is not just converting grain into fuel – it is converting irrigation water and groundwater into automobile exhaust.

The Geography Makes It Worse

It is not just the volume of water that matters. It is where the water is being drawn from.

  • Maharashtra – facing recurring droughts in Vidarbha and Marathwada – hosts ethanol plants with a combined capacity of roughly 396 crore litres, much of it sugarcane-based.
  • Uttar Pradesh and Karnataka ethanol plants draw from groundwater reserves already classified as critically depleted.
  • Punjab and Haryana rice growers have been blamed for decades for depleting groundwater. Now the same rice is being industrially converted into fuel – yet the industry is not held to the same scrutiny.

Even NITI Aayog’s own 2021 ethanol blending roadmap explicitly acknowledged the heavy water burden of 1G feedstocks and recommended a shift toward more water-efficient alternatives and advanced second-generation biofuels. Five years later, the warning has only become more urgent.

The Wastewater No One Talks About

There is a third dimension to the water story that rarely makes the headlines: vinasse. Ethanol distilleries produce large volumes of vinasse – a high-organic-load wastewater that, if not treated to strict standards, contaminates surface water and groundwater. Scaling up 1G ethanol means scaling up vinasse generation in the same water-stressed regions where the feedstock is being grown.In short: 1G ethanol uses water to grow the crop, uses water to process it, and risks polluting water as it disposes of the byproduct. Three water hits per litre. And every one of those hits is concentrated in states that are already running short.

Why 2G Ethanol Solves Both Problems – At Once

This is the moment where second-generation ethanol stops being an academic concept and becomes the most important fuel pathway in India’s energy transition.

2G ethanol is produced from lignocellulosic biomass – agricultural residues that are either burned in fields, used for low-value applications, or left to rot. The most abundant feedstock is rice straw (paddy straw), of which India generates roughly 160–180 million tonnes every year – a significant share of which is currently set on fire in Punjab and Haryana, contributing to North India’s winter air pollution crisis.

Compare that to 1G ethanol on the two dimensions that define this debate:

On Food

  • 1G ethanol takes food crops or food-grade grain (sugarcane, maize, rice) and converts them into fuel.
  • 2G ethanol uses the residue left after the food has already been harvested. The grain still goes to the kitchen. The stubble – which was going to be burned anyway – goes to the fuel tank.

On Water

  • 1G ethanol carries the full water footprint of the crop – 3,000 to 11,000 litres per litre of ethanol, depending on the feedstock.
  • 2G ethanol uses only process water (a few litres per litre of ethanol). The crop was grown for food; the residue is a free byproduct. No new agricultural water demand is created.

Put together, 2G ethanol is the only pathway that allows India to scale toward E25, E27, and E30 without enlarging the food-fuel conflict and without deepening the groundwater crisis.

It also delivers four additional benefits that 1G cannot:

  • It eliminates a public-health hazard. Every tonne of rice straw converted into ethanol is a tonne not burned in an open field.
  • It creates a circular bio-economy. The same biomass yields ethanol, plus high-purity precipitated silica, plus gypsum – multiple revenue streams from a single residue stream.
  • It is feedstock-resilient. Agricultural residues are generated regardless of whether sugar prices spike or grain markets tighten.
  • It produces deeper lifecycle carbon savings, because the alternative for the feedstock was either combustion (releasing CO₂ anyway) or decay (releasing methane).

Policy Has to Catch Up With Physics

India’s biofuel policy framework has been built on the assumption that 1G ethanol can carry the country to higher blending mandates. The data – on food diversion, on water footprint, on regional groundwater stress – is increasingly making that assumption untenable.

Three policy shifts are now overdue:

  • A defined feedstock cap on 1G ethanol. The total volume of food-grade rice, sugarcane juice, and maize that can be diverted to ethanol annually should be capped – preferably at or near current levels – with all incremental demand from E25/E27/E30 met from 2G pathways.
  • Differential pricing that reflects the true cost of 1G ethanol. If 2G ethanol is more capital-intensive but uses no incremental water and no food, the pricing structure should compensate for that – not penalise it. The current pricing regime undervalues the externalities saved by 2G.
  • Aggressive scaling of 2G capacity. BPCL’s commercial 2G plant at Bargarh, Odisha (commissioned March 2026, processing 100 KLPD from rice straw) is a proof point. PM JI-VAN Yojana provides the scheme. What is missing is execution velocity – and that requires biomass aggregation policy, faster land acquisition, and risk-sharing on first-of-a-kind 2G plants.

Where Khaitan Bio Energy Fits In

The case for 2G ethanol becomes meaningful only when the technology to produce it works economically and at scale. That has been the longstanding gap in India’s biofuel ecosystem – and it is the gap [Khaitan Bio Energy](https://khaitanbioenergy.com/) was built to close.

The company’s patented 2G ethanol technology, developed by Mr Rohit Khaitan and validated through a BIRAC-supported pilot under the “Cellulosic Ethanol Pilot Plant for Rice Straw Management” project, establishes a commercially viable cellulose-to-sugars-to-ethanol pathway.

Three credentials matter in the context of the E30 conversation:

  • The technology is certified at Technology Readiness Level 8 (TRL-8) by the Department of Biotechnology, Government of India – meaning it is ready for commercial deployment, not still in lab stages.
  • It is the rare 2G platform that fully utilises every component of lignocellulosic biomass – delivering not only ethanol, but also high-purity precipitated silica and gypsum as co-products. This breakthrough in lignin valorisation is what transforms 2G unit economics from marginal to competitive.

For an India trying to scale to E30 without burning more food and draining more groundwater, this kind of platform is not optional. It is the bridge between what policy is targeting and what the country can actually sustain.

The Road Ahead

The E30 standards notified by BIS in May 2026 are an enormous opportunity. They signal that India is serious about energy sovereignty, serious about supporting rural incomes, and serious about decarbonising transport. None of that is in dispute.

What is in dispute is the path. If India tries to reach E30 by pouring more rice, sugarcane, and maize into distilleries, the country will trade its imported-oil problem for two problems it is far less equipped to solve: a food security problem and a water security problem.

If, instead, India scales to E30 by building out 2G ethanol capacity – turning the rice straw that is currently burning into fuel, and leaving the food crops where they belong – the same blending mandate becomes one of the most powerful sustainability levers any major economy has ever pulled

The fuel is the same number on the petrol pump. The path determines whether E30 is a triumph or a trade-off.

Frequently Asked Questions

Q1. What is E30 fuel and is it available now in India?

E30 is petrol blended with 30% ethanol. On May 15, 2026, the Bureau of Indian Standards notified IS 19850:2026, formally establishing technical specifications for E22, E25, E27, and E30 fuel blends. The notification does not immediately mandate the nationwide sale of E30 – it creates the regulatory and technical foundation for a phased rollout. ARAI is currently studying engine compatibility for higher blends starting with E25.

Q2. How does 1G ethanol affect food security in India?

First-generation (1G) ethanol is produced from food crops – primarily sugarcane, maize, and rice. In March 2026, the government reduced the share of broken rice in PDS allocations from 25% to 10%, redirecting roughly 90 lakh tonnes (9 million tonnes) of rice annually from the public food distribution system to ethanol distilleries. As blending mandates rise from E20 toward E25 and E30, the volume of food crops being diverted to fuel will grow substantially.

Q3. How much water does it actually take to produce one litre of ethanol?

It depends entirely on the feedstock. Using Food Secretary and NITI Aayog data: rice-based ethanol uses approximately 10,790 litres of water per litre of ethanol (cultivation + processing); maize uses around 4,670 litres; sugarcane uses approximately 3,630 litres (some NITI Aayog estimates put it at 2,860 litres). In contrast, 2G ethanol made from rice straw uses only a few litres of process water per litre of ethanol – because the feedstock is agricultural residue, not a separately grown crop.

Q4. Isn’t India producing surplus rice that would otherwise go to waste?

FCI stocks have indeed exceeded buffer norms – but as the CAG and standing committee reports have pointed out, this reflects procurement and storage inefficiencies, not genuine food surplus. The same grain could be redirected to fortified school meals, anganwadi programmes, disaster relief, and urban nutrition schemes, or held as a strategic buffer against climate-driven supply shocks. “Broken” rice is also nutritionally identical to whole rice – categorising it as industrial feedstock is a policy choice.

Q5. How does 2G ethanol solve the food and water problem simultaneously?

2G ethanol uses lignocellulosic biomass – primarily agricultural residues like rice straw, wheat straw, and bagasse – that are left over after the food crop has already been harvested. The grain still goes to the kitchen; the stubble (which would otherwise have been burned or left to decay) goes to the fuel tank. Because the crop wasn’t grown for ethanol, no incremental water is consumed, and no food is diverted. It is the only pathway that genuinely decouples ethanol scale-up from food and water pressure.

Q6. What is NITI Aayog warning about India’s groundwater?

NITI Aayog’s Composite Water Management Index has warned that 21 major Indian cities – including Delhi, Bengaluru, Chennai, and Hyderabad – face critical groundwater depletion by 2030. India’s per capita water availability has fallen to ~1,486 cubic metres (2021) and is projected to drop to ~1,140 cubic metres by 2050. Agriculture already uses ~80% of India’s freshwater. Scaling 1G ethanol in this context adds an industrial claimant to the same shrinking water base

Q7. How is Khaitan Bio Energy positioned for India’s E30 transition?

Khaitan Bio Energy holds patents for a 2G ethanol production technology certified at TRL-8 by the Department of Biotechnology and selected for commercial biorefinery development under the PM JI-VAN Yojana. The technology converts rice straw and other lignocellulosic biomass into ethanol – without competing with food crops or drawing additional agricultural water – and uniquely valorises lignin to produce high-purity silica and gypsum as co-products. For an E25-to-E30 future, this is exactly the kind of platform India’s energy transition will rely on.

India’s Ethanol Push to 25%: Why 2G Ethanol
Is Now Essential to Meet E25 Demand

India’s ethanol blending programme has moved at a pace few clean-energy policies have
matched. The country hit its 20% ethanol blending (E20) target in April 2026 – nearly five
years ahead of the original 2030 deadline. And almost immediately, the conversation has
shifted.
In May 2026, the Bureau of Indian Standards (BIS) notified technical specifications for E22,
E25, E27, and E30 fuels, opening the door to ethanol blends well beyond the current
mandate. The Petroleum Ministry has asked the Automotive Research Association of India
(ARAI) to study the impact of E25 fuel on engine life and mileage in existing E10- and
E20-compliant vehicles.
The direction of travel is clear: India is preparing for a future where one in four litres of petrol
is ethanol.
But behind the policy momentum sits a harder question. Can India actually produce
enough ethanol – sustainably – to meet E25 and beyond?
The answer, increasingly, points in one direction. Second-generation (2G) ethanol –
produced from agricultural residues like rice straw – is no longer a long-term
aspiration. It is becoming a near-term necessity.

Why India Is Pushing Beyond E20

The push to E25 is not happening in a vacuum. It is being driven by a convergence of
pressures – geopolitical, economic, and environmental – that have made ethanol one of the
most strategically important fuels in India’s energy mix.

1. Crude Oil Volatility Has Become Structural, Not Cyclical

India imports more than 85% of its crude oil requirement, making it the world’s
third-largest oil importer at around 5.5 million barrels per day.
The disruptions of the past year have made that dependence painfully visible:

  • The Strait of Hormuz crisis in early 2026 disrupted approximately 40% of India’s
    crude oil imports, over 50% of urea imports, and nearly 90% of LPG imports
    simultaneously.
  • About 52% of India’s crude imports transit the Strait of Hormuz, alongside roughly
    60% of LNG and almost all of its LPG.
  • The Indian Basket crude price has shown sharp month-on-month swings through
    2025–26, forcing the government to absorb significant excise revenue losses to
    keep retail fuel prices stable.

The Petroleum Ministry has since diversified, securing nearly 70% of crude imports outside
the Strait of Hormuz, but the structural vulnerability remains.

In this environment, every percentage point of ethanol blended into petrol is a percentage
point of energy sovereignty.

2. The Economic Returns of Ethanol Are Now Proven

India’s ethanol programme has already delivered measurable economic outcomes:

  • Over ₹1.25 lakh crore in payments to farmers through ethanol procurement
  • Over ₹1.44 lakh crore saved in foreign exchange through reduced crude imports
  • Ethanol blending climbed from roughly 1.5% in 2014 to 14.6% in 2023–24 and
    crossed 20% in April 2026

These are not marginal gains. They represent one of the most successful agri-industrial
pivots in India’s modern energy history. The case for going further is now financial, not just
environmental.

3.The Environmental Math Is Compelling

Ethanol is not a perfect fuel, but on a lifecycle basis it offers meaningful emissions
reductions compared to petrol – and the benefits multiply when the feedstock is agricultural
waste rather than food crops.
According to Khaitan Bio Energy’s own technology benchmarks, every kilogram of 2G
ethanol used as fuel reduces approximately a kilogram of carbon dioxide
accumulating in the atmosphere.
Add the avoided emissions from eliminating open-field stubble burning – a major contributor
to North India’s winter air pollution crisis – and the climate case for advanced ethanol
becomes one of the strongest in India’s clean-energy toolkit.

The E25 Roadmap: What the BIS Notification Actually Means

The May 15, 2026 BIS notification – IS 19850:2026 – established formal technical
specifications for E22, E25, E27, and E30 fuel blends for use in positive-ignition (petrol)
engine vehicles.
It is important to understand what this does and does not do:

  • It does not immediately mandate the nationwide sale of E25 or higher blends.
  • It does create the regulatory and technical foundation that automakers, oil marketing
    companies, and infrastructure providers need to plan investments.
  • It signals that the government is preparing for a phased rollout – likely beginning with
    E25 – once vehicle compatibility and infrastructure readiness are established.

Officials have indicated that moving from E20 to E22 is technically straightforward. The
jump from E20 to E25, however, is described as a “significant” step, requiring engine
testing, fuel system compatibility validation, and dispensing infrastructure upgrades.
The All India Distillers’ Association has welcomed the notification, noting that E25 will help
absorb surplus production capacity and create stable, long-term demand for the sector.

The Supply Problem: Why 1G Ethanol Alone Cannot Get India
to E25

On the surface, India appears to have plenty of ethanol. The country’s installed ethanol
production capacity has scaled to roughly 2,000 crore litres (20 billion litres) per year, with
an additional 400 crore litres expected to come online by FY27.
Against this, the E20 demand requirement is around 1,050 crore litres. So the immediate
question becomes: if capacity already exceeds E20 demand, why is 2G ethanol urgent?
The answer is in the trajectory, not the snapshot.

The Demand Curve Is Steepening

According to industry estimates, ethanol demand is expected to rise to:

~1,200 crore litres by ESY 2026–27 (under E20 plus initial higher-blend rollout)

~1,600 crore litres by ESY 2029–30 (with E25 and growing FFV adoption)

15–25 billion litres of additional dependable capacity required if E85 and E100
flex-fuel pathways are pursued at scale

That last figure – sourced from bioenergy industry analysis – implies fresh investments of
₹1.5–2 lakh crore, with 2G plants representing a significant share given their higher capital
intensity.

The Feedstock Ceiling on 1G Ethanol

First-generation (1G) ethanol in India comes from three main sources:

FeedstockApprox. share of 1GKey constraint
Sugarcane molasses
& juice
~45%Water-intensive; competes with
sugar production; vulnerable to
monsoon variability
Maize~30%Competes with poultry feed;
price-sensitive
Broken / surplus rice
(FCI)
~20%Limited by FCI stock levels and food
security policy
Damaged grain &
others
~5%Limited volumes

Each of these feedstocks has a natural ceiling. India has already had to restrict sugar and
broken rice diversion to ethanol during low-production years to protect food prices. The
2024 ethanol year saw blending dip toward 11.5% due to feedstock shortages – a reminder

that 1G ethanol is exposed to the same agricultural risks the policy is meant to insulate India
from.
In short: the more India relies on food-based ethanol, the more it imports an
agricultural vulnerability in place of an oil vulnerability.
This is the structural reason E25 – and certainly anything beyond it – cannot be built on a 1G
foundation alone.

Why 2G Ethanol Is the Bridge to E25 and Beyond

Second-generation ethanol is produced from non-food lignocellulosic biomass – primarily
agricultural residues that today are either burned in the open or used for low-value
applications.
The feedstock pool is vast:

  • Rice straw (paddy straw): ~160–180 million tonnes generated annually in India,
    with a significant share burned in fields
  • Wheat straw: another major residue stream, particularly in northern states
  • Sugarcane bagasse: currently used primarily for boiler fuel in sugar mills
  • Corn stover, cotton stalks, and other crop residues: largely uncommercialised

Unlike 1G ethanol, 2G ethanol offers a combination of advantages that align directly with
India’s energy and climate objectives:

  • It does not compete with food crops. The feedstock is waste, not food.
  • It directly addresses stubble burning – one of the largest preventable
    environmental harms in northern India.
  • It produces deeper lifecycle emissions reductions than 1G ethanol because the
    feedstock would otherwise have decomposed or burned.
  • It enables a circular bio-economy, where co-products like silica, lignin derivatives,
    and bio-gypsum create additional revenue streams from the same biomass.
  • It is feedstock-resilient – agricultural residues are produced regardless of whether
    sugar or grain markets are tight.

For an energy strategy looking to scale from E20 to E25 to potentially E85 or E100 over the
next decade, the question is no longer whether 2G is needed. It is how fast it can be built.

Government Policy: From PM JI-VAN to the Next Wave

India’s policy framework for 2G ethanol has been steadily building:

  • PM JI-VAN Yojana – the flagship scheme to support commercial 2G ethanol
    biorefineries using lignocellulosic feedstocks
  • National Policy on Biofuels (2018, amended 2022) – recognises 2G ethanol as an
    “advanced biofuel” with higher pricing support
  • Long-Term Offtake Agreements (LTOAs) between oil marketing companies and
    dedicated ethanol plants, providing pricing and demand stability
  • Interest subvention schemes for distillery construction, including grain and
    lignocellulosic plants
  • BPCL’s commercial 2G refinery in Bargarh, Odisha, commissioned in March
    2026, processing rice straw into approximately 100 kilolitres of ethanol per day – a
    proof point that 2G technology has moved from pilot to commercial reality

The Global Biofuel Alliance, launched under India’s G20 presidency, further positions the
country as a leader in advanced biofuels diplomacy, opening doors to technology
partnerships and export markets.
What the sector now needs is the next layer of clarity: defined blending targets beyond E20,
transparent pricing for 2G ethanol that reflects its higher capital intensity, and accelerated
land and biomass aggregation policies.

Challenges That Must Be Addressed

The path from E20 to E25 – and onward – is not frictionless. Five challenges stand out

  • Vehicle compatibility. Existing E10/E20 vehicles will need ARAI-validated testing
    for E25 compatibility. Beyond E25, dedicated flex-fuel vehicles become essential.
  • Fuel infrastructure. Higher ethanol blends require corrosion-resistant storage
    tanks, dedicated dispensing units, and upgraded blending terminals across
    thousands of fuel stations.
  • Capital intensity of 2G plants. A 2G ethanol plant typically costs significantly
    more per kilolitre of installed capacity than a 1G plant, requiring stronger policy
    support and risk-sharing.
  • Biomass logistics. Rice straw is bulky, seasonal, and dispersed. Building reliable
    supply chains from farm to biorefinery is operationally complex.
  • Capacity utilisation of existing 2G plants. Earlier 2G installations in India have
    struggled to operate at design capacity, underlining the need for proven, scalable
    technology platforms.

These are real challenges. They are also solvable – and several are already being
addressed.

Where Khaitan Bio Energy Fits In

India’s ethanol roadmap from E20 to E25 to E85 will not be delivered by policy alone. It will
require technology platforms that can convert vast quantities of agricultural residue into
ethanol economically, reliably, and at scale.
This is precisely the gap that Khaitan Bio Energy has been built to address.
The company’s patented 2G ethanol technology – developed over many years by Mr Rohit
Khaitan and validated through a BIRAC-supported pilot under the “Cellulosic Ethanol Pilot

Plant for Rice Straw Management” project – establishes an economically viable
cellulose-to-sugars-to-ethanol pathway. The technology has been certified at Technology
Readiness Level 8 (TRL-8) by the Department of Biotechnology, Government of India,
indicating commercial deployment readiness, and has been evaluated by the Centre for High
Technology under the Ministry of Petroleum and Natural Gas.
It has also been selected for setting up commercial biorefineries under the PM JI-VAN
Yojana.
What distinguishes the approach is the comprehensive utilisation of every component of
lignocellulosic biomass – producing not only 2G ethanol, but also high-purity precipitated
silica and gypsum as co-products. This breakthrough in lignin valorisation transforms the unit
economics of 2G ethanol, addressing one of the longest-standing challenges in
commercial-scale cellulosic ethanol production.
For an India targeting E25 and beyond, technology pathways that solve the rice straw
problem while producing low-carbon transportation fuel and industrial co-products are
exactly the kind of innovation the country’s energy transition will rely on.

The Road Ahead

The notification of BIS standards for E22 through E30, the ARAI study on E25, the BPCL
Bargarh commissioning, and the continuing volatility in global crude markets are not isolated
developments. Together, they describe a sector approaching a turning point.
India’s ethanol story has so far been driven by sugar mills, grain distilleries, and policy
ambition. The next chapter will be written by biomass, bio-refineries, and breakthrough
technology.
The shift from E20 to E25 may sound like a small numerical step. In reality, it marks the
moment when India’s ethanol programme outgrows its first-generation foundations and
becomes structurally dependent on second-generation pathways.
For policymakers, the work is to define the next set of blending targets with clarity and
provide the pricing and offtake certainty that 2G investments require. For industry, the work
is to scale proven technologies fast enough to meet a demand curve that is now rising
steeply.
For India, the prize is significant: lower oil imports, cleaner air in farming states, higher rural
incomes, and a transport sector aligned with net-zero ambitions.
E25 is not just a higher number on the petrol pump. It is the point at which India’s
energy transition truly begins to compound. Development under the PM JI-VAN Yojana –
directly aligning with India’s need to scale 2G ethanol for higher blending targets.

Decarbonization: Alternative Fuels for India’s road transportation sector 

Growing populations and rapid economic growth influence India’s rising energy consumption. India’s third-highest consumer of final energy is the road transport industry, which is virtually entirely dependent on petroleum oil. Nearly one-fifth of the nation’s import expenditure—more than four out of every five percent of crude petroleum—comes from imports. In 2018, India contributed around 7% of the world’s energy-related CO2 emissions, of which the transport industry was responsible for 13%. Alternative fuels have been researching in India for approximately 20 years to decarbonize the road transportation industry and solve energy security, efficiency, and air quality difficulties. 

Electricity and biofuels can provide significant prospects for the near-term decarbonization of the road transportation industry. Hydrogen and compressed natural gas both have the potential to be essential players in this area throughout the short, medium, and long term.

Options and current situation for transportation’s alternative fuels

Alternative fuels, including biofuels (ethanol and biodiesel), CNG, methanol, electricity, hydrogen, etc., have been considering for development and use in India among the various choices. The Government of India (GoI)’s “Auto Fuel Policy, 2003” made several recommendations, including the use of CNG/LPG in cities with higher vehicular penetration, accelerating the development of battery electric, hydrogen, and fuel cell vehicles (FCV), and developing sustainable biofuel production technologies based on locally available resources as well as vehicles for their use.

Recent changes in the power mix of India, the evolution of shared mobility solutions that maximize the use of expensive transportation assets, and improvements in battery chemistries have all contributed to the favourable environment for the growth and adoption of electric mobility. The following sections contain information on the governmental actions implemented, particularly in India, to promote the development of various alternative fuels for use in road transportation and the advancements made compared to international successes.

Biofuels

Ethanol and biodiesel are the two main liquid biofuels produced and used worldwide. While corn, sugar cane, and other crops are primarily using to make ethanol, animal and vegetable oils, including used cooking oil (UCO) from kitchens, are using to make biodiesel. In addition, the production of hydro-treated vegetable oil (HVO) and hydro-treated esters and fatty acids (HEFA) from the same feedstocks used to make biodiesel for use as a diesel alternative is growing. Additionally, it anticipates that between 2023 and 2025, the average global biofuel production will increase to 182 BL.

Development in India

The GoI mandated the usage of exclusively non-edible oilseeds for biodiesel production to stop the gap between the demand and supply for edible vegetable oil in the nation from getting even more comprehensive. By adding ” additional states to the program in 2006, the requirement for the provision of E5 was expanding to a broader geographic spread of the nation. Due to the scarcity of ethanol, India experienced difficulties with its biofuel initiative, much like many other nations worldwide. India’s National Policy on Biofuels, enacted in 2009, permits the purchase of ethanol made from non-food feedstocks such as molasses, cellulose, and lignocellulose materials. By the end of 2017, the plan is to achieve the aim of 20% ethanol and biodiesel admixing in gasoline and diesel, respectively.

Compressed natural gas

In its compressed form, known as CNG is another form of alternative fuel. Natural gas mainly consists of methane, may be utilized in three-wheeled auto-rickshaws, vehicles, and municipal buses, and CNG pressure might be increased to 250 bar. The usage of CNG as an automotive fuel has advanced, and it is currently prevalent in many nations. CNG provides advantages over other fossil fuels in decreased CO, CO2, NOx, and particulate matter 

 emissions. Its widespread availability, compatibility with spark ignition (SI) and compression ignition (CI) engines, and inexpensive operating costs influence its acceptance. 

As of December 31, 2019, over 28.54 million CNG-powered cars were operating worldwide, refuelling at 33,383 stations in more than 85 nations. According to the highest percentage of CNG-fueled automobiles, China, Iran, India, Pakistan, and Argentina are the top five nations. 

Development in India

The adoption of a sizable number of CNG cars in India was possible by the local capability to make NG vehicles. The GoI’s favourable policy framework has also made it easier for people to acquire CNG automobiles. As of March 31, 2020, these initiatives have resulted in a combined stock of around 3.38 million CNG-fueled cars and the construction of 2207 CNG refuelling stations throughout 20 Indian states and four centrally managed territories. During 2019–20, these vehicles accounted for about 6.7% of all NG consumption. By 2030, 33 million CNG-powered cars and 10,000 CNG refuelling stations will be in India. Including imported LNG (33,680 MMSCM), India consumed 63,932 M metric standard cubic meters (MMSCM) of NG in 2019–20 

Compressed Biogas

The anaerobic digestion of various wastes/biomass resources from agricultural, dairy, municipal sewage treatment facilities, solid waste from cities, etc., can result in the purified and compressed form of compact biogas (CBG). CBG is another alternative fuel for achieving dercarbonisation. It then mixes with NG or CNG or used as a CNG or LNG replacement to lessen reliance on imports. Regarding composition, energy content, and other characteristics, CBG is comparable to commercial NG and has a methane proportion above 0.95. India can produce 62 MTA of CBG from a variety of resources. 5,000 CBG system expects to install nationwide in stages by 2025 under the GoI SATAT program, which began in 2018. These systema anticipates to produce 15 MTA of CBG or around about 30% of NG consumption of 48.65 MTA in the country during 2019–20

Liquefied Petroleum Gas(LPG)

LPG, a propane and butane combination commonly referred to as “autogas” in some countries, may also used as a transportation fuel when not mixed. It is a fuel with comparatively low carbon emissions. Auto LPG is the world’s third most used automobile fuel, powering more than 27 million cars. Additionally, it is cost-effective for the user and extends engine life while lowering maintenance costs. With roughly 71,000 dispensing outlets, over 70 countries is using auto LPG.

Development in India

The Auto Fuel Policy, 2003 of the GoI proposed, among other measures, the use of these gaseous fuels in cities with a more significant population of automobiles after realizing the advantages associated with alternative fuels such as CNG and LPG. Additionally, in 2014, the GoI released the Auto Fuel Vision and Policy 2025, which provided a roadmap for a swift transition to the new emission standards specified in BS-IV throughout India.

Despite offering the user economic benefits and being more environmentally friendly than gasoline and diesel, auto LPG has only achieved limited success in India due to unfavourable policy frameworks for its expansion. Additionally, few auto LPG vehicles are made in Indi. And retrofitting auto LPG kits is preferred because this market is unregulated. 

Methanol

Resources, including coal, NG, and biomass that can create syngas, is using to make methanol. Methanol is an efficient fuel that emits less NOx and PM pollutants than gasoline and no SOx emissions because it contains no Sulphur. For usage as an automobile fuel, it then combines with gas or used as a complete replacement. Methanol, however, is more corrosive than gasoline, may require significant infrastructure improvements for its storage and delivery, and is extremely dangerous to people if eaten. 2019 saw an estimated 98.281 MT of methanol produced globally. In which 19.777 MT was utilizing as an alternative fuel for blending with gasoline and combustion, manufacturing of biodiesel and dimethyl ether, and in fuel cells.

Development in India

India is still in the early stages of methanol production; in 2018–19, domestic production was just approximately 0.27 MT, compared to the installed production capacity of 0.47 MT. In 2019, it imported 2.3 MT of methanol. The majority of Indian methanol production now relies on imported NG. Thus, the country may use its substantial coal deposits to produce methanol to blend with gasoline or completely replace it. The ability to produce methanol might be increased using biomass, stranded gas, and high-ash coal from India. Coal India Ltd. is now putting up a factory using coal to produce 0.676 MT of methanol. In Assam, a trial program for cooking using canister-based methanol started in 2018. 

Electricity for transportation

The two primary elements of the modern energy system are electricity and liquid fossil fuels, with electricity supplying very dense energy globally for various uses, including lighting, propulsion, refrigeration, communication, and computation. Electricity is a very efficient and clean energy source after the generating stage. Over 90% of electricity is using efficiently in motors to produce rotary motion for various everyday applications. Because of these characteristics, electricity is a crucial energy vector for movement.

The introduction of ICE-based cars and a lack of adequate infrastructure for power distribution and battery recharging, including the time required for recharging, were some of the causes that led to the end of the first golden era of EVs. In the past ten years, interest in EVs has once again risen due to concerns about vehicular emissions, climate change, and energy security being brought to the attention of policymakers and automakers. While the switch to electric mobility is still in its early stages in some nations, the adoption of EVs is accelerating in some of the world’s largest markets for personal vehicles due to falling battery prices and expanding EV charging infrastructure. Of different kinds, including cars, buses, taxis and shared vehicles, light commercial vehicles (LCV), two/three-wheelers and heavy-duty vehicles with short-range requirements such as urban deliveries.

Development in India

When Bharat Heavy Electricals Ltd hired to build an “Electra van” with 18 seats for usage in Delhi and other major cities, the introduction of electric mobility in India officially began in the early 1980s. About 200 of these vehicles developed and put on display. Eddy Current Control (India) Ltd. created the first electric vehicle in India in 1993. After that, electric three-wheelers/rickshaws, e-bikes, and a tiny electric automobile (Reva) get developed and used in 1996.

The National Electric Mobility Mission Plan (NMEPP) 2020 was created in 2012, and the Ministry of Heavy Industries and Public Enterprises, Government of India, launched the first phase of Faster Adoption and Manufacturing of (Hybrid &) Electric Vehicles (FAMHEV) in 2015 [80], [81]. With a budget of US$ 140.7 million, Phase-I of FAMHEV (also known as FAME-I in India) carried out from April 2015 to March 2019. Following that, FAMHEV-II (or FAME – II) launched in April 2019 for three years with a total allocation of US$ 135.86 million to promote e-2 Wheelers, e-3 Wheelers, e-4 Wheelers, 4W vigorous hybrids, and e-buses as well as the establishment of charging infrastructure. The amount of financial support for EVs depends on the battery’s capacity.

Hydrogen

In light of its potential to play a significant role in decarbonizing the transportation, industrial, and household sectors and thereby offering solutions to climate change-related issues with which the entire world has been grappling in recent years, hydrogen has been attracting a lot of attention from policymakers, environmentalists, researchers, automobile companies, and others. The most prevalent and lightest element in nature is hydrogen. Among all available fuels, hydrogen has the highest gravimetric energy content (120.7 MJ/kg), 2.7 times more calorific than gasoline. Additionally, it is environmentally friendly because it only emits water vapour when it is being used. Hydrogen has a lengthy history of use in energy-related applications.

Since 1975, the demand for pure hydrogen increased more than three times and predicted to reach more than 70 MT in 2018. Because it can lower GHG emissions, provide energy independence, and enhance the ambient air quality in the areas that choose to use it. Whereas Hydrogen is seen as an appealing energy source for vehicular applications.

Development in India

Since about 30 years ago, the Government of India has supported a wide range of R&D activities in the nation, realizing the significance of hydrogen for supplying the energy needs of the transportation sector and for distributed power generation. The Ministry of New and Renewable Energy (MNRE), GoI, created a National Hydrogen Energy Roadmap (NHER) in 2006, intending to accelerate the research and commercialization of hydrogen-based technologies in India. NHER focused on projects based on public-private partnerships to help with resource creation.

The primary goals were to outline the development, testing, and deployment of technologies for using hydrogen energy in the transportation and power-generating sectors and to make it possible to build the necessary infrastructure throughout the nation. It entailed concentrating on the growth of various links throughout the complete hydrogen energy value chain, from its production to its availability for ultimate use and resolving concerns linked to its safety and standards. Only a few sets of two-wheelers, three-wheelers, catalytic combustion cooking systems, small power generating systems, hydrogen internal combustion engines (HICE), and FC buses have been developing. These have only undergone limited field testing. Activities for developing hydrogen-fuelled vehicles (HFV), including hydrogen-compressed natural gas (H-CNG) and hydrogen-diesel dual fuel vehicles, got momentum in India after NHER came into existence.

The Heat is On: The Impact of Global Warming

We are all acutely aware of the current state of climate change. Wind patterns, temperature, air pressure, and humidity influence our climate. Several climates worldwide include dry, mild, tropical, and more. The seasons there are determined by the temperature. Since we are living creatures, our environment impacts all aspects of our existence. To live a regular life, we thus need a steady and healthy one. However, this trend is being disturbed by global warming.

How does global warming work?

Procedures that cause the earth’s temperature to grow consistently and continuously. A grave issue will put all living things in serious peril. Likewise, there are several causes for this occurrence.

Increased carbon dioxide levels and greenhouse gases are significant contributors to it. Living things will soon meet their demise if we do not take action to solve this issue. Furthermore, we must be aware of its adverse effects to act quickly to remedy it.

Everyone must be made aware of their role in the rising global warming. To rescue the world and all of its inhabitants, it is crucial that we discover a solution that will enable us to address this problem as soon as possible.

Impact of global warming

Global warming indicators

By now, we must all be aware that the earth’s temperature has risen by one degree Celsius. Even though it appears to be a modest number presently, the effects it causes are enormous. Increasing this temperature by even one degree Celsius requires significant energy, and our climate system would need to be force-fed with this additional energy.

A constant increase in the earth’s temperature is called global warming. The generation of greenhouse gases like carbon dioxide and methane is a significant factor in this increase. Several scientific arguments show that the earth’s temperature has risen, especially since the 1950s. The world’s climate system has warmed due to human activity during the past several decades, and it is expected that the global surface temperature will likely increase much more in the twenty-first century. This temperature increase is negatively impacting the earth’s life. Here is a thorough examination of the effects of global warming.

Effects on Climate

The precipitation pattern has changed due to global warming in several parts of the world. As a result, some areas are suffering flooding while others are experiencing draught-like conditions. In this manner, the moist parts become wetter while the dry ones get dryer. Along with other environmental changes, an increase in temperature is also causing storms, cyclones, heat waves, and wildfires. Global warming is causing extreme weather in many areas of the world, and the issue is only predicted to worsen. 

 Effects on Sea

Over the 20th century, the sea level has increased worldwide. This increase in sea level can be attributed to two main factors. Two things have happened: first, there was a thermal expansion brought on by the warming of the ocean, and second, there has been an increase in the melting of land-based ice. According to predictions, the sea level will increase significantly shortly. Living in coastal and low-lying areas is seriously threatened by rising sea levels.

 Effects environment

Because of global warming, the earth’s entire environment has suffered. This temperature increase worsens air pollution by increasing ground level ozone, which is created when smoke from industries, automobiles, and other sources reacts with heat and sunshine to generate ozone. Increased air pollution has brought numerous health issues, and things are worsening every day.

Effects of Life on earth

Life on Earth has been severely harmed by the rise in temperature, unpredictable climatic conditions, and air and water pollution. Numerous lives have been lost due to regular floods, droughts, and cyclones, and the rising pollution levels contribute to several health issues. 

Like humans, many other animals and plants cannot adapt to the shifting weather. They are suffering from the adverse effects of the quick changes in the land and water meteorological conditions. The number of animals and plants going extinct has increased. According to studies, the growing amount of pollution and climatic changes are to blame for the extinction of several species of birds, mammals, reptiles, fish, and amphibians.

Agriculture is Affected

The unpredictable rainfall pattern brought on by global warming has most severely impacted agriculture. While specific locations frequently experience draught-like conditions, others often see severe rain and flooding. This is harming the crops as well as the residents of those places. Crops are suffering, and agricultural fields are losing their fertility.

Sea Level Will Rise 1-8 feet by 2100

Since accurate records have been kept since 1880, the sea level has increased by around 8 inches (0.2 meters) worldwide. If carbon emissions continue at their current rate, by the year 2100, experts predict they will have risen by at least another foot (0.3 meters) and perhaps even by as much as 8 feet (2.4 meters). The expansion of seawater as it heats and the additional water from melting land ice are the two main causes of sea level rise.

Even small sea level changes can cause increased flooding because storm surges and high tides combine with sea level rise and land sinking along coastlines to amplify flooding in some regions. Sea level rise will continue past 2100 because the ocean takes a long time to respond to warmer conditions at Earth’s surface fully. As ocean waters continue to warm, sea levels will continue to rise.

Changes in the climate will persist throughout. 

It is predicted that the global climate will continue to warm throughout this century and beyond. The quantity of heat-trapping gases generated by people and how susceptible the Earth’s climate is to those emissions determine the extent of climate change and the severity of repercussions.

Hurricanes Will Become Stronger and More Intense

The intensity of North Atlantic hurricanes and the frequency of the strongest hurricanes have increased since the early 1980s. Scientists project that hurricane-associated storm intensity and rainfall rates will increase as the climate continues to warm.

Longer Wildfire Season

Warming temperatures have made the wildfire season longer and more severe in the West, and deepening drought in the region has increased the risk of fires. Scientists estimate that human-caused climate change has already doubled the area of forest burned in recent decades. By around 2050, the amount of land consumed by wildfires in Western states is projected to increase by two to six times. Wildfires are projected to increase by about 30% in rainy regions like the Southeast.

Globally, fire weather seasons have lengthened. Drought remains the dominant driver of fire emissions, but recently there has been increased fire activity in some tropical and temperate regions due to warmer temperatures that increase vegetation flammability. The northern boreal zone (Earth’s northernmost forests) near the Arctic is also experiencing more prominent and frequent fires, which may increase under a warmer climate.

More fires and a more extended fire season are causing an additional health hazard of wildfire smoke, which affects tens of millions of people in the United States. Meanwhile, the costs of fighting wildfires have risen 11-fold over the past 30 years, adding a financial burden on top of the public health risk.

More heat waves and droughts 

Heat waves (prolonged periods of exceptionally hot weather) and droughts in the Southwest are expected to intensify, making cold waves less severe and more common. The temperature is expected to rise throughout the year. 

Modifications in Rainfall Patterns 

The United States has unequal effects of climate change on precipitation (rain and snow), with some areas experiencing greater rainfall and floods while others are facing drought. Scientists predict that the northern United States will get more winter and spring precipitation this century than the Southwest.

Future climate projections over the U.S. suggest the recent trend toward increased heavy precipitation events will continue. This means that while it may rain less frequently in some regions (such as the Southwest) when it does rain, heavy downpours will be more common.

The growing season (and the frost-free season) will extend.

 Since the 1980s, the length of the frost-free season and the accompanying growing season have increased, with the western United States experiencing the largest increases. The lengthening of the growing season will continue across the country, impacting ecosystems and agriculture.

The length of the growing season is predicted to expand by a month or more throughout the majority of the United States by the end of the century if heat-trapping gas emissions continue to increase at the current rates, with slightly lower increases in the northern Great Plains. The frost-free season might last eight weeks in the western United States, particularly in high-elevation and coastal regions. If we decrease our emissions of gases that trap heat, the rises will be noticeably less. 

Arctic Is Very Likely to Become Ice-Free

Sea ice cover in the Arctic Ocean is expected to continue decreasing. The Arctic Ocean will likely become ice-free in late summer if current projections hold; this change will likely occur before mid-century.

Conclusion

The issue of global warming is quite severe and has disastrous consequences. Immediate action must be taken to reduce carbon emissions to mitigate the effects of global warming. This is feasible if every person puts forth a little effort for the cause.

Decarbonizing the Power System

Goal of decarbonizing power system

The energy industry is experiencing a worldwide change. Renewables’ costs have plummeted significantly over the last decade—solar power up to 80% and wind power by roughly 40%—making them economically competitive with traditional fuels like coal and natural gas in most global markets. As a result, renewables are rapidly expanding: in 2018, they accounted for the vast majority of new power-generation capacity. In most markets, they are now the most cost-effective way to expand marginal capacity. Furthermore, for decarbonizing the power system renewables are crucial to any country’s goal to reduce greenhouse gas (GHG) emissions.

However, neither the sun’s nor the wind’s direction can changed. As a result, unlike baseload power facilities powered by coal, gas, or nuclear energy, wind and solar output cannot be continuously matched to demand. That raises a problem. Municipalities, states, countries, and utility companies all need affordable, dependable power. Many people have also established objectives to decarbonizing their electricity systems. How do they manage both?

For considerable amounts of renewable energy to integrate, flexibility (the capacity to control the erratic nature of non-dispatchable electricity) such as wind and solar power is essential. The real-time synchronization of supply and demand may achieved in various ways. For instance, gas and coal power plants may shift output up or down to balance wind and solar energy output variations, and production may balance geographically via transmission lines. Demand-side management programs and well-designed incentives can persuade people to change their consumption patterns.

Image showing decarbonization

Decarbonizing the electricity system to between 50 and 60 per cent by 2040

In most markets, achieving 50 to 60 percent decarbonization with little to no additional expenditure is possible beyond what is dictated by just rational economic behaviour. Decarbonization is frequently the least expensive choice since solar, wind, and storage costs—three crucial components in all deep-decarbonization scenarios—have fallen so far and so quickly.

Midrange storage (four to eight hours) works well with the sun’s 24-hour cycle. “Solar-plus storage” refers to the ability to store energy during the day. And release it at night to ensure a consistent supply of electricity . In reality, wind and solar energy frequently work in tandem since the former is stronger at night and during the winter, when the latter is. Therefore, solar and wind resources markets are better equipped to handle intermittency.

The performance of the electricity system normally wouldn’t be significantly impact reaching this degree of decarbonization. We project that 2 to 5 percent of the electricity generated would curtailed, and almost all of it undergoes various utilizations. Individual fossil-fuel plants’ utilization levels, or the proportion of time a plant produces power, would likewise not considerably changed, remaining at 50 to 60 percent. However, some assets will decommissioned and replaced when more affordable renewables come online, and no new transmission would likely required. Simply put, few changes would need to be made to the electricity system to reach a 50–60% decarbonizing goal.

Decarbonizing the electricity system to between 80 to 90 per cent by 2040

It will often cost more, take longer, and need more market-specific initiatives to reach 80 to 90 percent decarbonization. Even if there is no need for new technologies, storage would have to utilized for longer periods, and demand may need to controlled more strictly. This may done by actively managing building heating, cooling, and industrial load shifting. Additional transmission interconnections may require for certain markets to combine renewable resources and share baseload resources over a greater geographic region.

The system would seem considerably different from how it does now at this level of decarbonization. Because so much renewable energy is producinig to fulfil demand during reduced output, we expect a 7 to 10% curtailment. Fossil-fuel plants are used less frequently (20–35%) as renewable energy sources gain popularity. However, many are maintaining on standby to supply demand when renewable energy sources cannot. The expenses of decarbonization at the 80 to 90 percent level vary greatly. There may be a slight decrease in system expenses (1 to 2 percent annually) in markets with higher than average power costs, and there may be gains in other, less expensive markets.

Decarbonizing the electricity system to between 100 per cent by 2040

Biofuels

 Landfill gas and biomethane are examples of net-zero-carbon renewable biofuels. However, due to their high cost and finite availability, they can often only partially contribute to the solution. 

CCUS

 stands for carbon capture, usage, and storage. With CCUS, greenhouse gas emissions from burning fossil fuels have applications in various processes like better oil recovery, or safely stored in deep rock formations. Although costly, CCUS is effective. Finding and implementing technology advancements and establishing scale efficiencies will be necessary to lower the cost. Additionally, as CCUS cannot collect every carbon molecule, other technologies will still require to achieve complete decarbonization.

BECCS

It stands for bioenergy carbon capture and storage. According to a method known as BECCS, carbon-neutral biomass, such as wood pellets and agricultural waste, undergo burning for fuel while the CO2 emissions that occur either captured or stored. The end outcome is negative emissions, or removing GHGs from the atmosphere. Biomass can be ramped up, but it is unclear how much because the technology is still relatively new. One benefit is the ability to convert old coal facilities into BECCS plants, which lowers capital costs and uses already-existing linkages. 

P2G2P

Power to gas to power. Using surplus electricity, P2G2P technology creates hydrogen that may stored in the gas network and then transformed back into power. The “clean gas” produced by P2G2P technology permits storage for weeks or even months. However, it is both costly and ineffective. The initial ten megawatts of generated power undergo tr6ansformation into usable power for consumption, roughly three megawatts remain. However, the flexibility offered by P2G2P technology might go a long way toward incorporating sporadic renewables if there is a demand for clean gas beyond the power industry.

DAC

DAC remove CO2 from air. It is another low-emission technology that might utilize to reduce the final few percentage points of electricity that is carbon-intensive. Although the technology has proven, it require enormous energy expenditures to capture, isolate, and sequester CO2. Additionally, doing so is highly costly. Our research typically indicates that it is not a component of the answer for complete decarbonization.

Net Zero Target

What is Net Zero?

Countries, cities and companies are increasingly committing to reaching net zero by 2050 – removing as much CO2 as they produce to limit global warming. By definition, net zero emissions means reducing greenhouse gas emissions to the lowest possible level, with any remaining emissions reabsorbed by the atmosphere by means of oceans and forests.

The energy sector is critical to addressing the global climate crisis as it is the primary source of worldwide emissions. Governments have made numerous commitments and efforts to tackle the causes of global warming. Yet, since the United Nations Framework Convention on Climate Change was signed in 1992, CO2 emissions from energy and industry have increased by 60%.
The number of international pledges and initiatives is rising. However, they are still far short of what is required to keep global temperature increases to 1.5 °C and prevent the worst effects of climate change. The goal to Net Zero by 2050 Roadmap, which identifies more than 400 milestones for what must be done and when to decarbonize the global economy within three decades, offers a roadmap to accomplish this challenging and vital goal. A normative IEA scenario called Net Zero Emissions by 2050 (NZE) shows how the global energy sector can achieve net zero CO2 emissions by 2050, with advanced economies achieving net zero emissions ahead of others. Short- and medium-term emission reduction goals, consistent with the Paris Agreement, are set all over the globe to eliminate the worst impacts of climate change this decade. 

The importance of corporate Net Zero targets 

To achieve this, we must balance what we harvest from the environment with the greenhouse gases we release into the atmosphere. 

So as to prevent the harmful effects of climate change, 197 nations pledged to maintain temperature increases well below 1.5°C under the Paris Agreement in 2015. 

In its report from 2018, the Intergovernmental Panel on Climate Change (IPCC) concluded that “global net human-caused carbon dioxide emissions would need to fall by about 45% from 2010 levels by 2030, reaching net zero around 2050. pooiiz

Accordingly, any remaining emissions brought on by human activity that cannot be reduced must be offset by removing CO2 from the atmosphere.

Khaitan on the way of Net Zero target

An increasing number of countries, cities and organizations have pledged to reach this goal within 2050. Thus turning the net zero promise into a mainstream act. Khaitan bioenergy aims on net zero and decarbonisation by being part of organizations that support target. The initiative “Net Zero Tracker” has mapped out the number of net zero pledges of countries, cities, regions, and organizations. The focus is to get an impression of how significant an impact these entities may have on reaching the target. According to the reports, 90% of the worldwide economy is committed to achieving net zero. Out of 2000 of the largest publicly traded companies worldwide, the Net Zero Tracker has identified 683 with target. 

Global Net Zero coverage

 Net Zero targets by various corporates

On an organizational level, the quality of the net zero targets varies. While some companies have set ambitious targets for deep emission cuts, others have set modest emissions reduction targets. Mainly lacking detailed abatement planning. The variation in the quality and structure of targets makes it harder to compare companies’ net zero targets and their implications.  

The Net Zero Standard 

The net-zero commitments need to translate into quantifiable goals and plans for which businesses can held responsible. Net zero aims are now more transparent, comparable, and likely to be of high quality. And also it succeed by being in line with standards. One such standard that provides substance and direction to targets is the SBTi’s (Science Based Targets Initiative) Net Zero Standard. The SBTi Net Zero Standard offers a comprehensive, common net zero concept grounded in science. The standard is the first of its kind in the world to give businesses a way to contribute. Also to making the world economy reach the goal.

Corporate net zero targets vary in three ways: the target’s boundaries, the mitigating measures selected, and the deadline for achieving the target. Aiming for significant emission reductions in its scopes 1, 2, and 3 of at least 90% by 2050 . Also halving their emissions by 2030, businesses to comply with the Net Zero Standard must set both long and short-term goals.

According to the Net Zero guiding principles, there are two requirements for achieving net zero and keeping warming to 1.5°C: 

  1. Achieve value-chain emission reductions on a scale. It is consistent with the level of mitigation reached in paths that keep global warming to 1.5°C with no or minimal level. 
  2. To permanently remove an equivalent amount of atmospheric Carbon dioxide. Thus to offset the effects of any remaining sources of residual emissions. 

Corporate net zero targets are crucial for businesses to demonstrate that the private sector can advance the fight against climate change. Pledges for net zero are becoming more common, but setting a science-based goal demonstrates accountability.

Refinery Carbon Reduction

The following strategic actions should follow to reduce direct CO2 emissions at oil refineries:

Energy efficiency

Improvements in energy effeciency considered by many as a cost-effective mitigation method. Although they may only be able to reduce emissions by 5-10%.
The rebound effect, a phenomenon that would somewhat offset the advantages. It has also been suggesting as a possible outcome of increased energy efficiency made possible by technological advancements.
Increases in energy efficiency cannot primarily drive the decarbonization of the refining sector.

Carbon Capture and Storage

Since the 1970s, the oil and gas refineries has pioneered using CCS technology. It mainly focus for enhanced oil recovery (EOR), establishing a foundation for its implementation in other CO2 mitigation applications.
There has been extensive research on using CCS technology to lower emissions in refineries.
The general view is that collecting CO2 from larger combined emission stacks is feasible.

The forecasts include CO2 capture from bigger emission sources. It may be steam methane reformers, fluid catalytic converters, crude atmospheric and vacuum distillation units, and power plant stacks.
According to their assessment, the CO2 capture and compression system comes in second place. With a cost of 47%, followed by interconnectors. It retrofits at 38% and utility plants operating on natural gas at 15% of the total cost of CO2 avoidance.
On the other end, several emissions from boilers, heaters, or furnaces dispersed around a refining site are more complex to control because of their lower CO2 concentrations and flow rates, as well as the possibilities for contaminants.
The economics of CO2 capture from various diverse point sources is still poorly understandable. Thus site-specific assessments need for a more accurate estimation.

Fuel Shifting

Fuel shifting is another important to choose the appropriate approach considering fuel combustion contributes to about 70% of a refinery’s emissions.
Switching to biomass could produce a significant environmental burden and potentially disrupt the biomass industry, despite being appealing in terms of CO2 reduction and cost.
Also, because of administrative and security concerns, direct-fired heaters and boilers utilizing solid biomass are considering as impractical in oil refineries.

On the contrary line, gaseous fuels, specifically for the combined heat and power (CHP) plant, could function as drop-in fuels without the requirements for extensive refinery operations restructuring.
Although there is an anticipation that the operation of hydrogen-fired boilers will be as stable as that of their natural gas equivalents, such boilers have not undergo testing in a manufacturing environment. Thus raising the question about the type of heat transfer and the degree of gas emissions.
The same is for electric heating if operating costs dramatically lowered and the technology demonstrated to be dependable.

The worldwide energy sector in 2050 is based mainly on renewables, with solar the single largest source of supply.
All governments must have a single, constant objective while collaborating closely with corporations, investors, and citizens to bring about this cleaner, healthier future.

Environmental Sustainability- Challenges And Opportunities

Sustainability is the capability to endure. Sustainability is the long-standing maintenance of welfare that has social, economic, and environmental measures. Also it covers the idea of union, a mutually dependency, and interlinking with every living and non-living thing on earth. This theoretical understanding moves well beyond definitions driven by growth-oriented economic perceptions for the challenges and opportunities for achieving sustainability. This consider humans as offering stewardship, the responsible resource management.

Most of the organizations experience several challenges to achieve environmental sustainability internally and externally. These challenges should addressed by applying opportunities that are available and accessible to these organizations.

The environmental issues on earth have extended radically in the past decades, and they are currently among the main threats and challenges which impact people’s lifestyles and organisational processes worldwide.

All businesses have felt these effects, but usually, under-developed countries carry the highest weight. Our primary goal in this paper is to discuss the trends, opportunities and challenges associated with environmental sustainability, primarily in industries and organisations.

Environmental Sustainability Challenges

Innovation-based scenario

Considerable vitality and rapid growth rates illustrate several markets in developing divisions and innovative companies or organizations. Organizations or businesses in these industries may control their environmental change or effect by creating resourceful ecological policies. This approach without implementing efficient environmental administration structures is the main challenge for reaching sustainability.

However, the rate of market development can counterbalance the environmental effectiveness and achievements the firm is getting. When sales increase fast, enhancements in environmental effectiveness happened quicker than market growth to get total environmental gains or advantages.

This is a significant challenge that several industries and organisations must pass through when they migrate from domestic to international markets or from minor to mass markets. Product, development, and business form innovations contribute significantly to harmonising growth.

High-risk scenario

The situations of minimal manageability and minimal development rates of the market proposed a condition where environmental sustainability is a complex challenge. This is an instance of erosion directives, air standard guidelines, climate directives, and condition services, such as fisheries, tourism, etc. The difficulty derives partially from the point that these gains are mutually created. Also from the fact that they are all spatially and partly unconnected to the organisation and industry structure.

Consequently, new green global authority needs to advance this challenges by engaging several organisations from varied institutional fields, including science, economics, politics, etc. For example, companies like PepsiCo Inc have been following an international policy on environmental sustainability. Some companies have decreased energy and water usage to decrease greenhouse discharge and reduce packaging and waste cost.

Climate Change

Climate change caused by human activities and its impacts on international development is an element of the broader challenge of attaining environmental sustainability. It needs a change of the process, amount of output, supply, and usage.

Since the international economy is factually unsustainable currently and cannot take in more economical. As increase in population also cause severe hazards of global destabilization or deterioration. The population rise directly cause increasing greenhouse discharges and their effects, the areas exploiting for goods and services prices, raised water shortage, increased oil prices, and so forth.

Environmental Sustainability Opportunities

Energy Efficiency

Industries and organisations have a technology that has considerably reduced non-renewable energy needs in housing. This sustainability trend sometimes achievable to build entirely passive houses that do not depend on all active systems for environmental management.

Enhancement to energy effectiveness engages decisions concerning the construction services and envelope. This can be either mechanical or electrical. Presently, insulation degrees in almost all housings are under the best possible levels, and related environmental changes continue to rise.

Glazing technologies provide industries and organisations such as Barclays banks enough opportunities to go considerably above their performance. Also the total price of developments, if minimal, matches up to future substitution required by elevating energy prices.

Industries must invest in renewable energy technologies. Because they have the possible environmental standard and stand for an opportunity to create or produce future incomes. Renewable energy that abides by dependable environmental quality is usually called Green Power. In order to differentiate it from other renewable resources which engages major ecological concerns such as the James Bay project .

Durability

Enhancing the durability decreases frequent incarnate energy and expenses related to protection, repair and replacement. Thus helps in attaining envelope durability in the durations of cold climate interprets into massive degrees of thermal insulation. However it is located outboard of the system or organisation.

Durable ends, fittings, machines and equipment must be chosen to balance the service life of the housing arrangement and envelope. Else the housing or building as a system will face challenges related to disparity durability.

Adaptability & Flexibility

Several industries, organisations, or business housings are destroyed since they grow outmoded and cannot efficiently contain new uses. Many reconstruction finances undergo consumption by issues linked to nonflexible and maladaptive housing systems.

Adaptability and flexibility reflections in housing systems need an assessment of widespread typology, which states the essentials of function and form while relating to the peculiarities of cultural position and temporal tenancy. An evaluation of these housing forms, which have provided various recreation series, offers an appealing difference to several current testing experiments.

Conclusion

Environmental sustainability has been the primary concern of governments, organisations and industries since it dramatically affects their process. To ensure environmental sustainability, stability is necessary between the protection of the ecological system, growth of the economy and safety of the social and cultural welfare of the people.

Business organisations may have advantages from environmental sustainability to a higher level. This will decrease dangerous effects on land, water, and air and assist them in adhering to statutory requirements.

Developed and underdeveloped countries are attending to climate change and the future environment, which has be essential for companies to integrate this impression into sustainability policies.

Environmental Sustainability And Trends

The environment means the surrounding. The environment can be natural or artificial surroundings. The surroundings usually affect and are affected by human activities.

Taking people as the central point, any other thing that surrounds humankind is the environment. People directly or indirectly depend on natural surroundings for their live hood. Also by exploiting these resources, men get food, industrial raw materials, and medicine. In the efforts to satisfy human satiable needs, the natural environment has been destroyed or damaged, affecting human life.

A healthy planet is requiring to reduce poverty, attain equality in resource distribution, and feed the current generation without limiting the future generation’s capability of providing for its population. Other than the economic effects of environmental damage, there are may important aspects that effects of the world’s gradual ecological damage. 

Environmental sustainability

Sustainable environmental management is the significant responsibility of states, firms, and individuals.

Sustainability is the process of utilizing limited natural resources efficiently and effectively without limiting the capability of upcoming generations to meet their own needs. Resources are not under equal distribution. However, they are enough for the entire world population only if they are well-managed and organized.

Despite this recognition of the need to protect the environment, forests, land, water, and fisheries are often over-exploiting by a few individuals who have influence and act in self-interest.

Clearly there is an excellent connection between environmental damage, industrialization and urbanization. According to the reports that human beings altered the natural environment and resulted in living in an unclean, polluted environment. On the other hand, the environment has limited the benefits that human beings could have derived from it.

Factors Affecting Sustainability

Environmental sustainability

Industrialization

The world is fast industrializing, and urban centres are growing. Industrial processes and urban populations emit pollutants into the environment, decreasing environmental sanity. When wastes are not disposed of correctly, they adversely affect the environment. Industries produce greenhouses for the atmosphere, have solid wastes on the earth service and utilize raw materials from the environment. When this is the case, then the environment is damaged.

Population Rise

With the increasing world population, and the need to meet its current conditions, the world is over-exploiting the available natural resources to the point that some have become exhausted. The exhaustion means that future generations cannot meet their needs from such resources. Some people are not aware of the need to manage and conserve the environment, and they misuse the available resources and do not see it as their role to protect the environment.

Over-exploitation

Selfishness for individuals and firms has resulted in damage and over-exploitation of natural resources as people aim to meet their needs. Indeed the need to meet generational needs has relaxed some national and international rules where governments are not actively enforcing them. 

Environmental Sustainability Trends

Transparency

Constructions, industries, and urban regions evaluate and disclose the use of energy, carbon discharge, and other environmental sustainability measurements. The landlords of commercial houses do not often have an opportunity. For example, five United States cities and three states have implemented policies which govern energy performance measurement and disclosure currently, and ten other states have proposed the implementation of these policies to support residents and investors in creating effective well-versed choices.

Transparency has grown in cities, and CDP requested 60 cities globally to account for environmental sustainability-associated information in 2011. Among them, 40 cities took action, with 35 taking responses from the public, which was the best idea.

CDP has increased its invitations to 150 cities worldwide. And they have experienced optimistic responses, along with unexpected knowledge and dedication on climate change matters by heads of cities. Clearly these city leaders identified that controlling water, energy, and waste would support the interests of the firms and tenants. Also it support to improve the standard of living in many approaches.

Global Consistency

Extensive reports for environmental sustainability by urban areas and multi-national corporations have strengthened. The reliable approaches to measure the efficiency of water, energy, and other environmental sustainability approaches from a global perspective.

Provided the broad local difference in environmental precedence all over the globe, the intended objective may not be a long international standard. But a method to interpret business activities and local government in international terms for measuring efficiency and identifying success.

LEED is the mechanism for ranking the housing environmental sustainability in the United States. It is often following in several countries with its mechanisms, as landlords aspire to magnetize global tenants.

In 2011, ISO 50001 standard was provided by International Organization for Standardization for energy. This organization structure contains conditions for measurement, certification, and accounting of energy usage.

Reliable measurements are vital to industries and companies. While they emphasize environmental sustainability in their personal functions and progressively all over their supply chain. As CDP cities are not putting any effort into rating the environmental sustainability of urban areas. Whereas they are building up an internationally cohesive background for recognizing the efficiency of environmental sustainability approaches followed by various industries and cities.

Public & Private Collaboration

Business organizations in the United States discovered their mutual goals in 2011. They recognized that association between private and public sectors and collaborative plans are frequently the efficient approach to overpower barriers to environmental sustainability. Some of these shared approaches would be felt mostly in 2012 and 2013.

The Better Buildings Challenge demonstrates the alliance between government and industries objectives in looking for carbon and energy decline and attaining these objectives as well needs support; for instance, organizations such as Greenprint Foundation and World Economic Forum have ordered reforms to loan supporting policies established by the legislative organizations to support funding of energy retrofits and more openly, states in America have realized that they can raise renewable energy installations at housing through providing inducements which would create solar power gainful for landlords within a moderately minimal time.

Jones Lang LaSalle, a section representing companies and government bodies, observes great unused synergy between companies and government bodies in attaining environmental objectives, especially in public and private associations.5 Taking one instance, airports and public bodies usually have surplus land, which is inappropriate for profit-making asset development such as the huge solar energy system.

Initiatives to attain the goal of environmental sustainability

Scientific innovations, inventions and development have resulted in better means of doing things to ensure minimal environmental pollution. The world is becoming a world village with improved transport and communication networks. The transport industry is the one that utilizes some of the world’s limited and exhaustible resources and fuel and then emits gasses that pollute the environment.

Collaborations among different countries have called for product improvement in such industries. Focus is currently on internal productions in a company where automation and recycling strategies embraced. To target different sectors and pollution, the international community is at the forefront of device mechanisms that will assist human beings in being sensitive to environmental damage. Such an initiative was the Kyoto Protocol on carbon emission.

Civil society, government and international bodies are targeting a transformation of human attitudes and perceptions towards the environment to ensure that people appreciate the need to conserve the environment for their and future generations’ good. The enlightenment from the massive campaigns is yielding fruits as people are becoming more sensitive about using the available resources.

The public is impacted by their attitude toward companies that do not have eco-friendly processes and products. A tendency is emerging that consumer power is forcing companies less concerned with the environment to revive their processes and products. Many companies have embraced corporate social responsibilities, which are targeting environmental conservation. These programs include tree planting, recycling and environmental education programs.

Conclusion

Humankind rely on the natural environment directly or indirectly for their live-hood. To ensure that the current generation meets its needs without limiting the degree to which future generation will meet theirs, Khaitan bio energy focus on effective conservation of the environment is necessary. Governments, international bodies, companies and individuals should join efforts to ensure minimal environmental damage.

Clean Energy

Clean energy is the energy from sources that release air pollutants, while green energy is derived from natural sources. There is a precise difference between these two energy types, even though they are often same.

Renewable energy is generated from sources that are constantly being replenished. Unlike fossil fuels and gas, these renewable energy resources won’t run out and include wind and solar energy.

While most green sources of energy are renewable, but not all renewable sources are green. For example, hydropower is a renewable resource. Still, some would argue that it is not green since the deforestation and industrialization for the construction of hydro dams may cause damage to the environment.

It is best to combine renewable energy sources with green energy, such as solar and wind power, to make the perfect mix of clean energy.

Asimple way to identify the differences between these are:

  • Clean energy means clean air
  • Green energy means natural sources
  • Renewable energy means recyclable sources

How does it work?

Clean energy produces power without adverse environmental impacts, such as releasing greenhouse gases like carbon dioxide. Solar power, wind power, and some hydro resources are all clean energy sources.

Why is it so Important?

The important aspect of clean energy is the environmental benefits of keeping mother earth clean. While clean, renewable resources save the world’s natural resources, they also reduce the threat of ecological disasters, similar to energy tumbles or the problems associated with natural gas leaks. With energy diversification through different power plants using various energy sources, it’s possible to produce dependable power inventories to enhance energy security, ensuring enough to meet our demands.

Advantages

Clean energy provides a variety of environmental and profitable benefits, including a reduction in air pollution. Different clean energy sources also reduce the need for imported fuels( and the associated fiscal and environmental costs they dodge).

Renewable clean energy also has essential cost savings, as there’s no need to extract and transport energies, similar to oil or coal, as the resources naturally replenish.

Another artificial benefit of a clean energy blend is the creation of jobs to develop, manufacture and install the clean energy coffers of the future.

How Can Clean Energy Be Used?

Wind power attaches a windmill to a generator, turning the blades into force. This form of energy has been using for centuries to grind grain, pump water, or perform other mechanical tasks. But it has various application in producing electricity. Onshore and offshore wind farms are becoming increasingly prevalent. Nevertheless, wind power can also utilized at a much smaller scale to generate electricity, even to recharge mobile phones. Aside from these examples of renewable sources, some include geothermal, biomass, and tidal power, which all have advantages and applications.

Applications

Clean energy have various applications, from electricity generation to heating water, depending on the energy source.

Solar energy has application in heating and lighting structures, generating electricity, heating water directly, and cooling. Solar panels allow power from the sun to collect and turn into electricity. For instance, numerous people use solar energy for batteries and small theatre lanterns. Still, this same clean energy technology can gauged up to larger panels that used to give power to homes or other structures or, indeed, installations of multiple solar panels, similar to a community solar panel array to entire power municipalities.

Water is another clean resource. Hydroelectric power plants are most apparent, which take water inflow from streams, rivers or lakes to produce electricity. A less quantity of water use comes through external pipes in municipalities and towns. Since there is a huge dependence on water in a day to day life, there’s a move towards employing this energy to help meet domestic and other power requirements. As generators are cheaper to make, this use of external water is getting closer to being a diurnal reality.

Wind power attaches a windmill to a creator, turning the blades into force. This energy has application for many years to grind grain, pump water, or perform other mechanical tasks, but it’s now used more frequently to produce electricity. Onshore and offshore wind granges are getting decreasingly current. Nonetheless, wind power can also employed at a much lower scale to produce electricity, indeed to recharge mobile phones.

Away from these exemplifications of renewable sources, some include geothermal, biomass, and tidal power, which all have advantages and operations.

The Future of Clean Energy

The future of clean energy looks bright. Recently there was an increase installation of renewable energy capacity globally than that of the combination of fossil fuel and nuclear power. Renewable sources now contribute more than one-third of globally installed power capacity. 

As the world population grows, an ever-increasing demand for energy and renewable sources is the answer to providing sustainable energy solutions while protecting the planet from climate change.

Cities and states are also creating policies to increase the usage of renewable energy, which is happening more than just nationally. Several places have set renewable energy portfolios to require a certain percentage of energy to generate from renewable sources. Over 100 cities worldwide now use at least 70% renewable energy. As more towns drive towards becoming 100% renewable, corporations also play an important role by purchasing huge dependency on renewable power.

Clearly, due to fossil fuels being a finite resource, it is clear that the future is renewable, so renewable sources expect to continue to increase in future.

How Can Clean Energy Reduce Global Warming?

Humans have been using fossil fuels for past many decades, and their use increases due to the release of the GHG that produced as a result of burning these fuels. These GHG trap hot rays of the sun in the atmosphere, causing the Earth’s temperature to rise. Global warming is a symptom of climate change that has led to increased extreme weather events, shifting wildlife habitats, rising sea levels and other effects.

Since renewable energy sources don’t result in the emission of GHG such as carbon dioxide, they do not contribute to global warming. Due to these renewable sources, climate change is not advanced, and measures such as reforestation can mitigate the damage already done to the climate.

Can Clean Energy Replace Fossil Fuels?

Since humans have been using fossil fuels for decades, meaning the switch to clean energy has been relatively recent. So, renewable energy sources are still unpredictable and need to meet our global demands for energy. This may show that renewable energy has to get replace with carbon-based sources.

However, it is clear that our energy needs can balance by efficiently storing renewable energy when the demand is present. Much work is focused to improve clean energy’s infrastructure and storage capabilities. With studies showing that clean, renewable energy may replace fossil fuels by 2050.

How Will Clean Energy Help Our Economy?

The creation of jobs related to the manufacture, installation and maintenance of clean energy solutions. It is one of the financial benefits of clean energy. Renewable energy and clean energy are growth sectors as the world moves away from fossil fuels. That means more opportunities will arise in eMobility for power generation and storage.

Of course, the financial implications of clean energy are just part of the story since the real intention behind using clean energy is to create a better future for this universe, so clean energy is good for the environment and a forward step for the industry.

Sources

Clean energy can be obtained from various sources. This, when put together, could create solutions for our energy needs.

  • A year’s worth of energy may generated by solar energy alone since the amount of solar energy that reaches the Earth’s surface in one hour is enough to cover the entire world’s energy needs. Of course, solar power has a limit in daytime, the seasons of the year and geographical location. Despite this, solar energy is already has application in both a significant and a domestic level.
  • Wind power is a form of clean energy, with wind farms providing an excellent contribution to power in the UK and elsewhere. When domestic ‘off grid’ wind energy is available, only some properties are suitable for wind turbines.
  • Hydropower is the main commercial clean energy source. This energy source is really more reliable than either wind or solar power and allows for the easy storage of the energy generate so that it can find uses in line with demand. Municipal hydropower also undergoes investigation, meaning that the future could see us all using water flow through pipes in our homes to generate electricity. The use of tidal energy is a large-scale version of hydropower that provides a reliable and predictable supply of energy, although it is not a constant source of energy.
  • TWI has been advancing geothermal power, which harnesses the heat below the Earth’s surface. This is to heat homes or produce electricity. This resource is highly effective in some regions than others. 
  • Biomass uses solid fuel created from plant materials to get electricity. Although this energy source still needs burning of stubbles. Usage of agricultural, industrial and domestic waste as solid, liquid and gas fuel is economical and has environmental benefits.

Is Clean Energy Clean?

All clean energy sources are ‘clean’ by definition. However, not all renewable energy sources are fully clean. For instance, burning wood from sustainably managed forests can be renewable, but it is not pure since this releases harmful gases into the atmosphere.

A truly clean and renewable energy source has zero carbon cost of production and storage, and that is what makes solar power and wind energy clean and renewable.

Summary

Clean energy is the future for the power needs of humanity across the globe as reliance on fossil fuels continues to diminish. As the drive towards clean, green and renewable energy continues to im[rove, the cost will fall, and so new plans to develop and install these new power solutions.

More and more people recognize the benefits of clean energy, and so more countries, states and nations sign up for a green power agenda; this will continue to advance.

Translate »